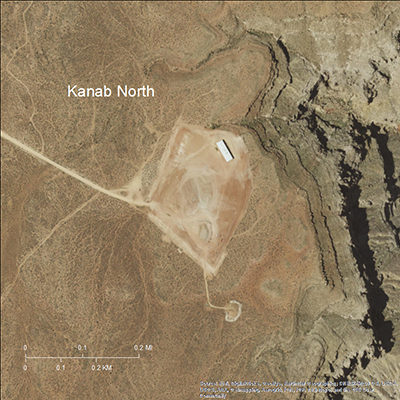
The Kanab North Mine is in the Arizona Strip (the area of Arizona north of the Colorado River), approximately 20 miles south of Fredonia and 1 half mile west of Kanab Creek, in Mohave County. It was mined from 1988 to 1991 and produced approximately 260,800 tons of ore which yielded 2,770,000 pounds of uranium oxide1. Milling was not done on site; all ore was shipped to a mill near Blanding, Utah2. The mine was placed on standby in 19923, with mine-waste rock present on the surface, until reclamation began in 2014.
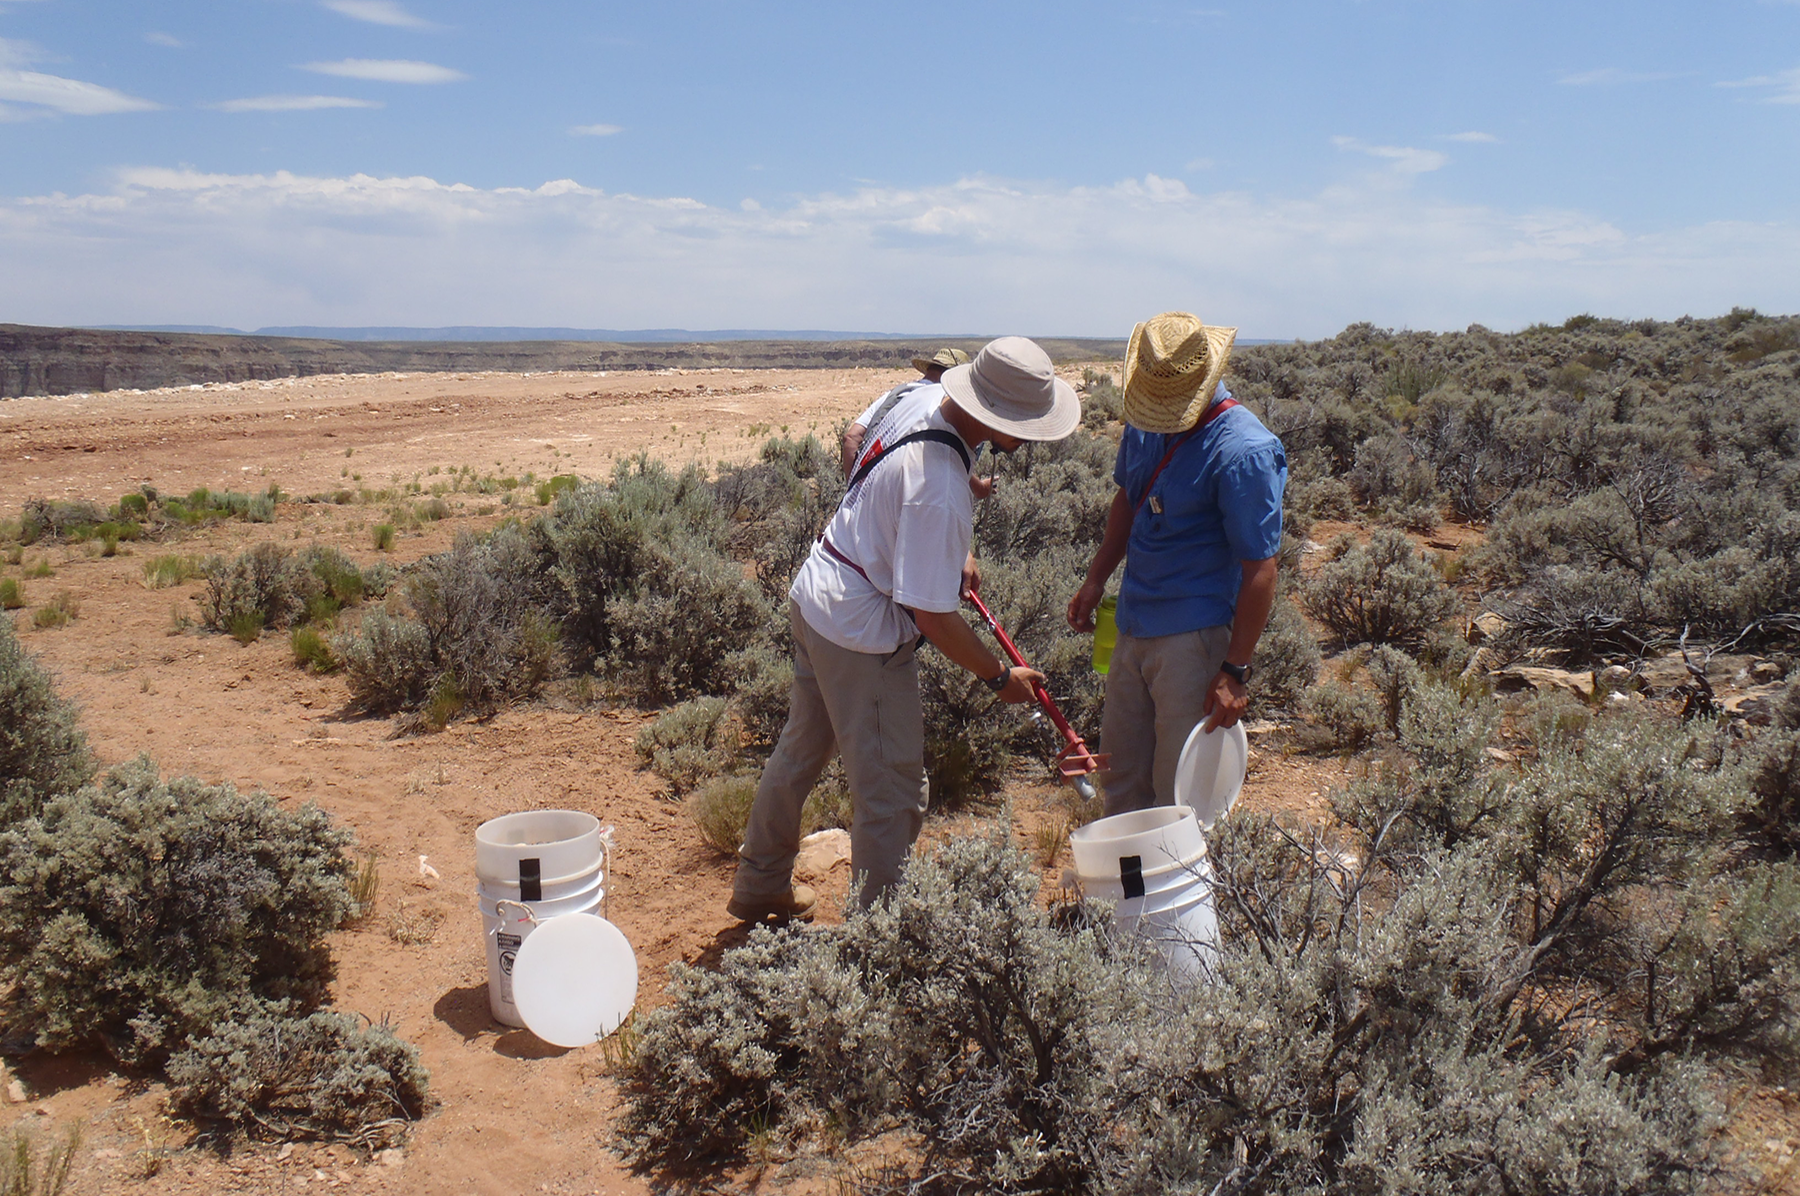
Initial seeding as part of restoration was completed in 2017. Soil data to examine the post-mining and post-reclamation distribution of metals and radiation in soil were collected in 20094, 2016, and 2018. Soil samples were collected in 2018 to characterize post-mining infiltration and chemical characteristics of the shallow subsurface (the unsaturated zone). Biological samples were collected in 2013 and 2015. Beginning in 2017, after initial seeding at the mine site, USGS began studies to examine the effectiveness of different plant restoration alternatives.
Click on image for a larger version.
Base map images are the intellectual property of Esri and are used herein under license. Copyright © 2016 Esri and its licensors. All rights reserved.
Click on image for a larger version.

Base map images are the intellectual property of Esri and are used herein under license. Copyright © 2016 Esri and its licensors. All rights reserved.
Activities listed below are scientific research studies occurring at this site. Studies within the Grand Canyon region are grouped by theme and each theme has specific tasks (referenced by task number).
The View Activity button below each task will open a separate window with detailed activity information.
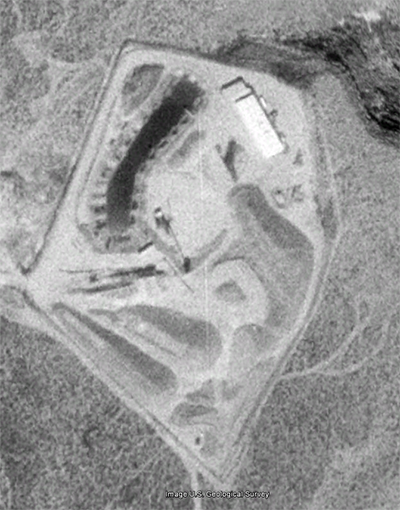
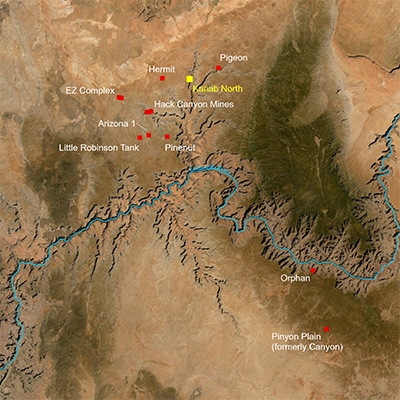
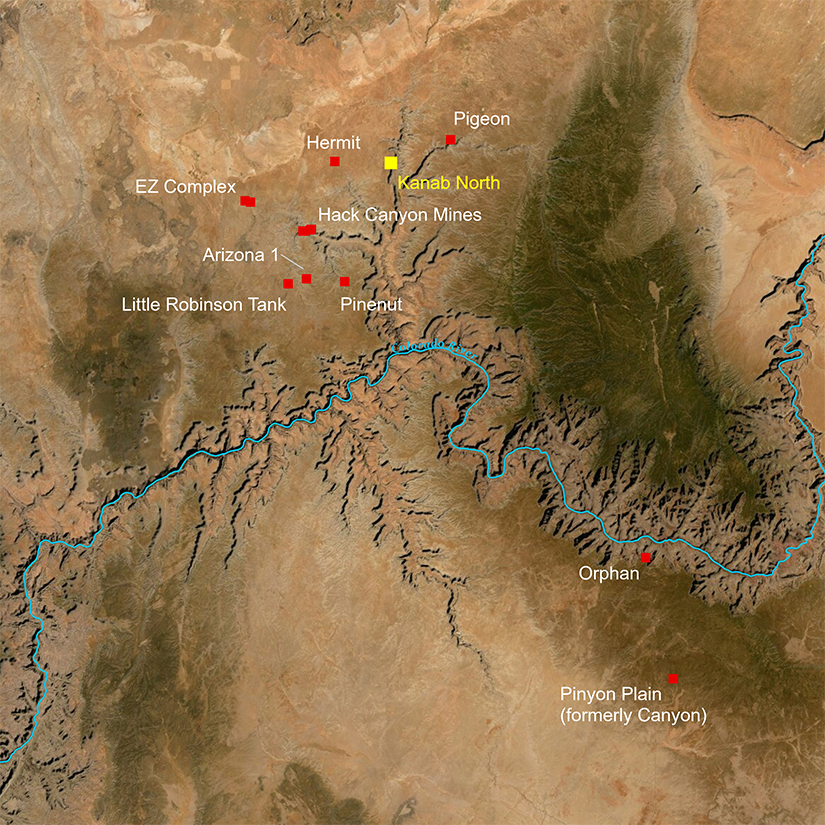
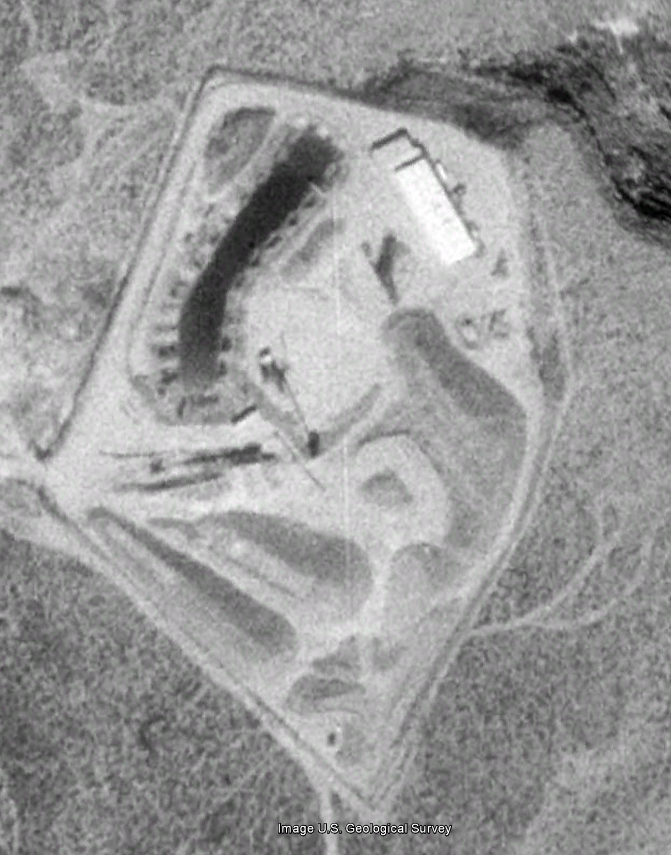
Click on image for a larger version.
Base map data from Google, U.S. Geological Survey, 1992.
Base map data from Google, U.S. Geological Survey, 1992.
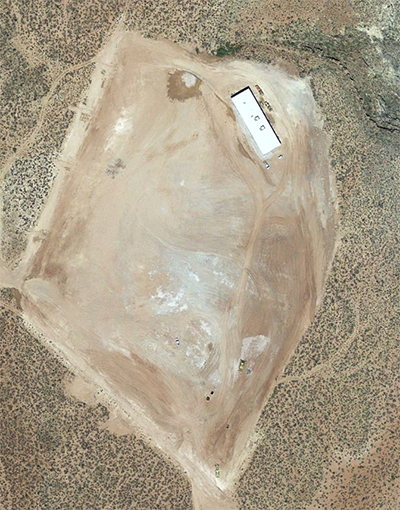
Click on image for a larger version.
Base map data from Google, 2015.

Base map data from Google, 2015.
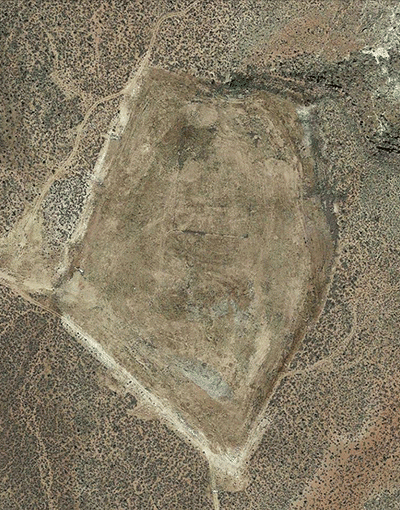
Click on image for a larger version.
Base map data from Google, 2019.
Base map data from Google, 2019.
Sources:
1 Ross, D.A., and Moreton, Christopher, 2012, Technical report on the EZ1 and EZ2 breccia pipes, Arizona Strip district, U.S.A.: NI 43-101 Report prepared by Roscoe Postle Associates Inc. for Energy Fuels Inc., 92 p., https://energyfuels.com/wp-content/uploads/2025/01/EZ1-EZ2_Technical_Report_June_27_2012.pdf
2 Alpine, Andrea E., ed., 2010, Hydrological, geological, and biological site characterization of breccia pipe uranium deposits in northern Arizona: U.S. Geological Survey Scientific Investigations Report 2010-5025, 353 p., 1 pl., scale 1:375,000
3 Otton, J.K., and Van Gosen, B.S., 2010, Uranium resource availability in breccia pipes in northern Arizona, Chapter A in Alpine, A.E., ed., Hydrological, geological, and biological site characterization of breccia pipe uranium deposits in northern Arizona: U.S. Geological Survey Scientific Investigations Report 2010-5025, p. 23-41
4 Otton, J.K., Gallegos, T.J., Van Gosen, B.S., Johnson, R.H., Zielinski, R.A., Hall, S.M., Arnold, Rick, and Yager, D.B., 2010, Effects of 1980s uranium mining in the Kanab Creek area of northern Arizona, Chapter B in Alpine, A.E., ed., Hydrological, geological, and biological site characterization of breccia pipe uranium deposits in northern Arizona: U.S. Geological Survey Scientific Investigations Report 2010-5025, p. 49-133