The Great Salt Lake is one of the largest saline lakes in the western hemisphere.
The lake and shoreline wetlands are a critical staging area along the North American Pacific Flyway. During peak migration, as many as 1.5 million shoreline birds have stopped at the lake. The Great Salt Lake also is an important economic driver, contributing approximately $1.3 billion to the Utah annual gross domestic product through aquaculture, recreation, and industrial activities such as mineral extraction and processing.
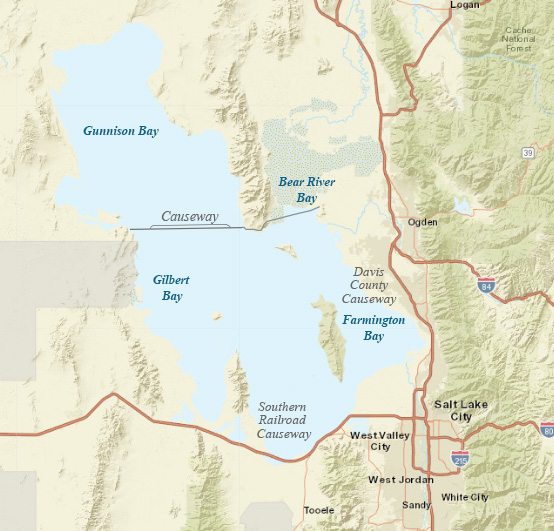
In 1959, a rock-fill railroad causeway was constructed across the middle of the Great Salt Lake. The construction of the causeway divided the lake into two parts; the north (Gunnison Bay) and the south (Gilbert Bay). Some water is conveyed through the causeway via engineered openings and the causeway material, depending on permeability. Because the south part of the lake receives almost all freshwater inflows, the salinity of Gunnison Bay is greater than the salinity of Gilbert Bay. Owing to its lower salinity, Gilbert Bay supports an ecosystem rich with brine shrimp and brine flies that attract millions of migratory birds and waterfowl as they travel the Central Flyway.
This website provides easy access to three information resources for Great Salt Lake:
Salinity and Lake Levels
Graphs that show the relationship between salinity and lake level as well as satellite imagery of the changing lake surface area.
Water Data
Lake levels for the southern and northern arms of the lake and discharge for locations on major surface water inflows are included.
Great Salt Lake Basin Water Dashboard
Interactive map that provides real-time stream, lake and reservoir, and groundwater data for USGS observation stations. Weather and other hydrologic information can be added as layers to the map.
Lake Characteristics Matrix
The matrix below shows a summary of resource characteristics at different lake elevation levels. Areas shaded green indicate the lake level is beneficial; areas shaded orange indicate the lake level is adverse for the resource. The arrows under Current Conditions indicate if the impact on the resource is beneficial (up arrow) or adverse (down arrow). Information presented in the matrix is from the Final Great Salt Lake Comprehensive Management Plan and Record of Decision.
The current lake level is Loading ft at the USGS Great Salt Lake at Saltair Boat Harbor.
Salinity and Lake Levels
Because the Great Salt Lake is located on a playa, small changes in lake levels result in large changes in the surface area of the lake.
Human development and use of water in the watershed have caused a decline in Great Salt Lake water levels of 11 feet since the late 19th century. Lake level declines have been accentuated by recent drought in the 2000s. In response to the extreme to exceptional drought conditions in 2022, Great Salt Lake levels broke record lows at the Saltair gage (site ID 10010000). As lake levels decline and salinity increases, these changes have implications to the Great Salt Lake ecology and economy the lake supports.
Use the sliders at the top of the graph to zoom into the data.
The chart shows the relationship between Great Salt Lake elevation and salinity over time.
This chart shows the volume-weighted salinity estimate for Great Salt Lake over time.
Lake Surface Area
1984-2023
Click on the image below to watch a time lapse of the lake.
Time-lapse satellite imagery of Great Salt Lake from 1984 to 2023 showing changes in lake surface area over time. The imagery illustrates major fluctuations in the size of the lake, including substantial decline during recent low-water years.
-
Smallest
(2022):
Approximately 890 square milesFrom Half-meter topobathymetric elevation model and elevation-area-volume tables for Great Salt Lake, Utah, 2002-2016 , 2023, U.S. Geological Survey data release.
-
Largest
(1986-87):
Approximately 2,300 square milesFrom Great Salt Lake An Overview of Change , 2002, Utah Department of Natural Resources Special Publication