
Summary of findings from Opsahl and others, 2018
Groundwater nitrate data from continuous water-quality monitors in combination with discrete water-quality samples from surface-water and groundwater sites throughout the San Antonio segment of the Edwards aquifer provide insight into nitrate contributions to the aquifer from rural and urban sources.
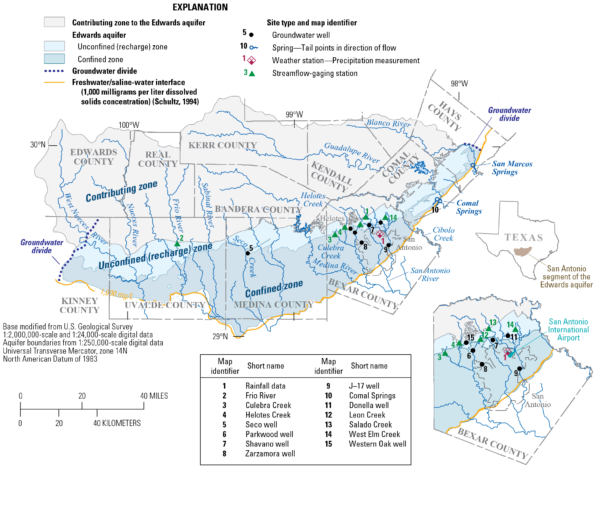
Hydrogeologic setting and site locations in the San Antonio segment of the Edwards aquifer, south-central Texas.
The Frio River site near Concan, Texas, was used to evaluate contributions of nitrate-nitrogen (nitrate-N) from surface-water recharge to the west of San Antonio.
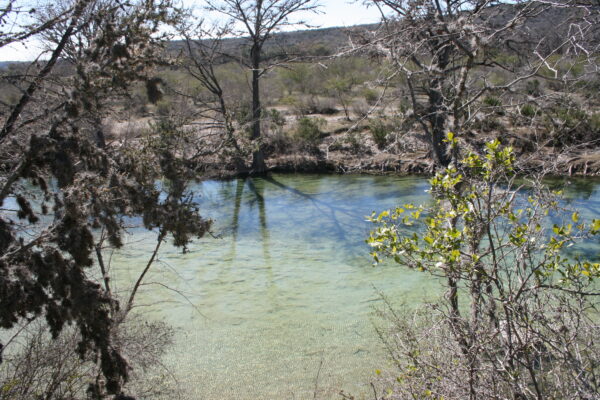
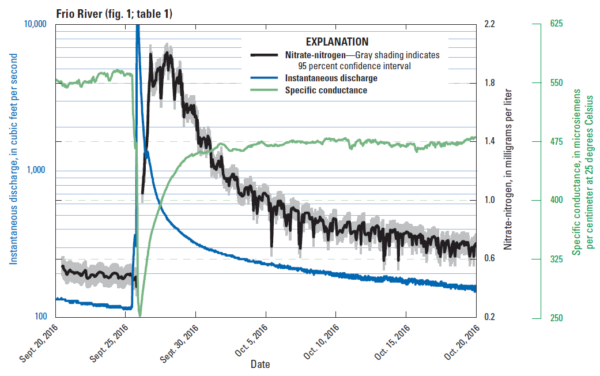
Instantaneous discharge, nitrate-nitrogen concentration, and specific conductance for a single stormwater-runoff event at Frio River (station 0819500), San Antonio segment of the Edwards aquifer, south-central Texas, September 20, 2016â€â€October 20, 2016. The shaded gray area associated with nitrate-nitrogen concentrations represents the probability range in error (plus or minus 0.07 milligrams per liter) with a 95 percent confidence interval. Gaps in the continuous record indicate missing data.
The Seco Creek monitoring well was used to evaluate temporal variability in nitrate concentrations in rangeland (rural) areas of the Edwards aquifer recharge zone west of San Antonio.
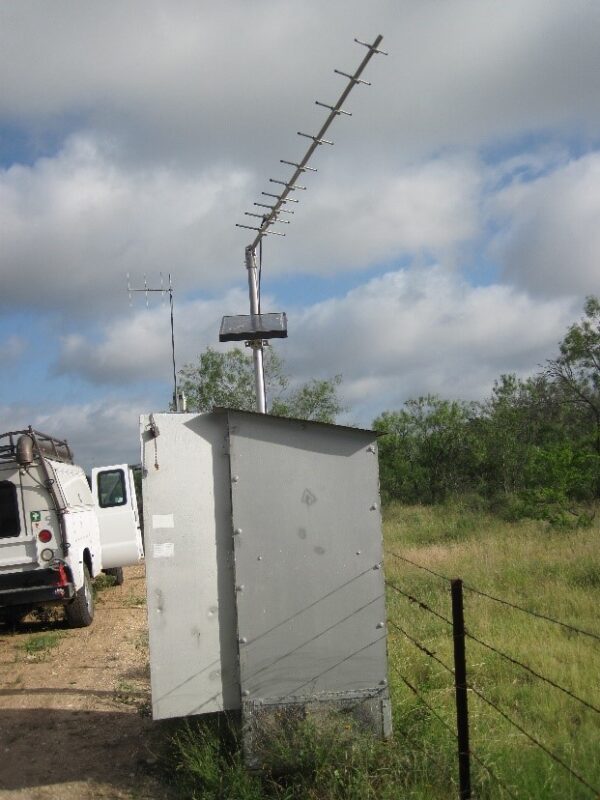
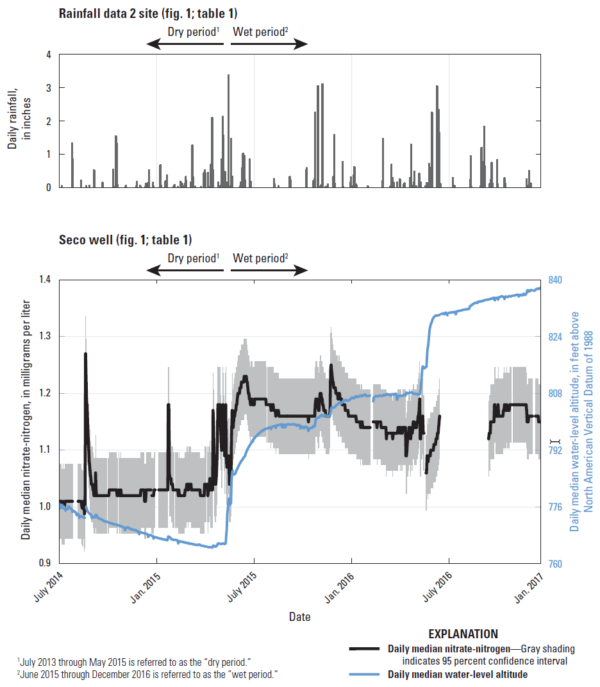
Rainfall, daily median water-level altitude, and daily median nitrate-nitrogen for Seco well, July 2014â€â€December 2016, San Antonio segment of the Edwards aquifer, south-central Texas. The shaded gray area associated with nitrate-nitrogen concentrations represents the probability range in error (plus or minus 0.07 milligrams per liter) with a 95 percent confidence interval. Gaps in the continuous record indicate missing data.
The Parkwood Park monitoring well, located on the north side of San Antonio and completed in the Edwards aquifer recharge zone, was used to evaluate temporal variability in nitrate concentrations in developed (urban) areas of the aquifer's shallow recharge zone in and around the City of San Antonio.
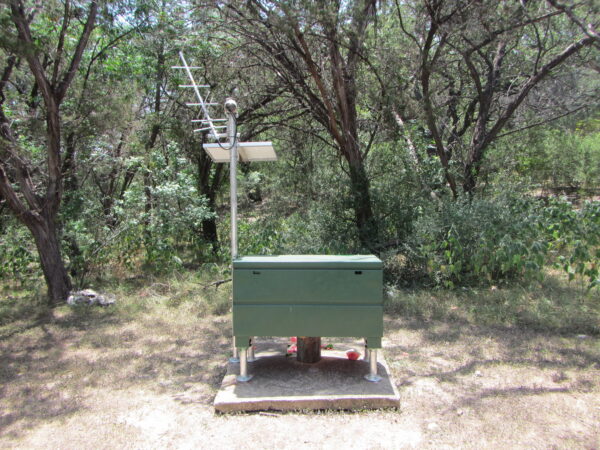
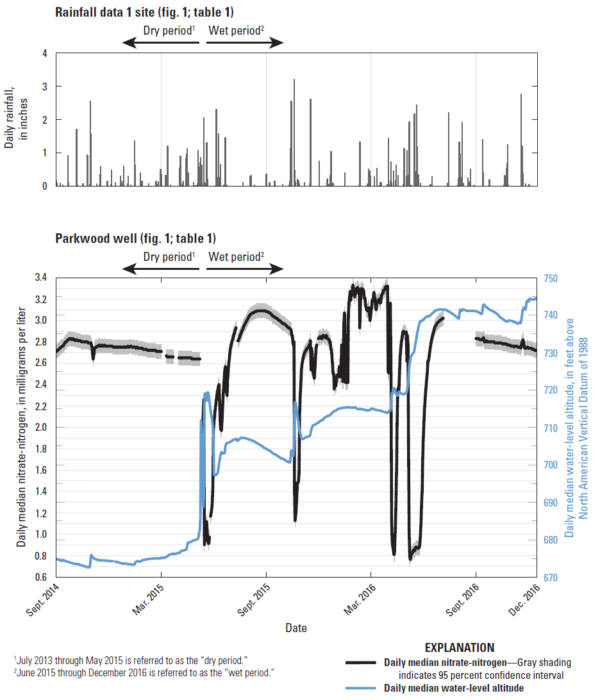
Rainfall, daily median water-level altitude, and daily median nitrate-nitrogen for Parkwood well, September 2014â€â€December 2016, San Antonio segment of the Edwards aquifer, south-central Texas. The shaded gray area associated with nitrate-nitrogen concentrations represents the probability range in error (plus or minus 0.07 milligrams per liter) with a 95 percent confidence interval. Gaps in the continuous record indicate missing data.