Integrated Hydrology + Data Science
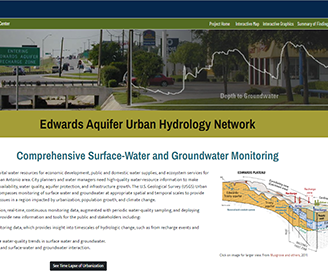
USGS scientists monitor surface water and groundwater resources at appropriate spatial and temporal scales to provide insight to complex hydrologic issues in a region impacted by urbanization, population growth, and climate change. Stakeholders needed an efficient way to explore and compare data from across the study area.
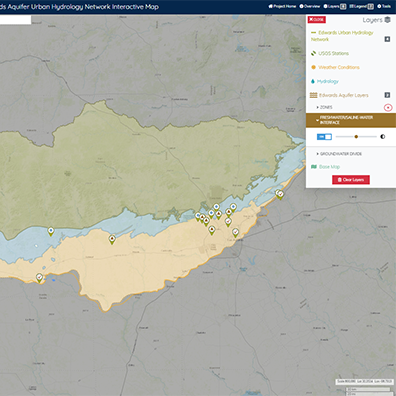
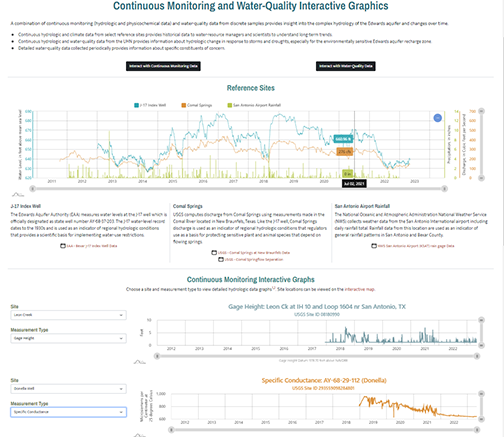
IHDS developers created data visualizations for continuous monitoring and water-quality data that allows users to interact with data from across the study area. An interactive map also was developed to allow users to visualize the aquifer extent compared to site locations. Important scientific findings are summarized and presented in an easy to read format.
App Development
Design Strategy
Javascript Development
Science Communication
Web Development
Web Analytics
Craft
Javascript
Leaflet
MySQL
HTML/CSS
Bootstrap