The Rio Grande is a vital water source for the southwestern States of Colorado, New Mexico, and Texas and for northern Mexico. Because streamflow in the basin is highly altered, disentangling the impacts of climate change and changes in streamflow due to anthropogenic influences such as dams, diversions, and other forms of water use is difficult. Therefore, a model that simulates naturalized flow (defined as streamflow that would occur in the absence of anthropogenic modifications) was developed to determine to what degree changes in streamflow can be attributed to potential changes in future temperature and precipitation without quantifying future changes in anthropogenic influences.
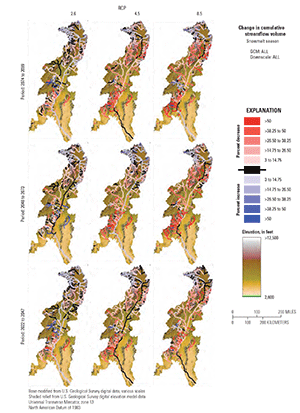
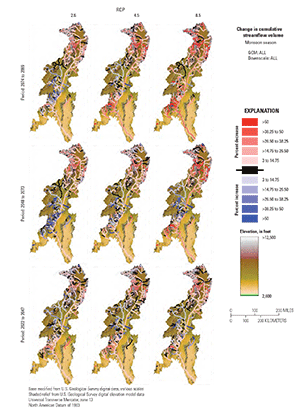
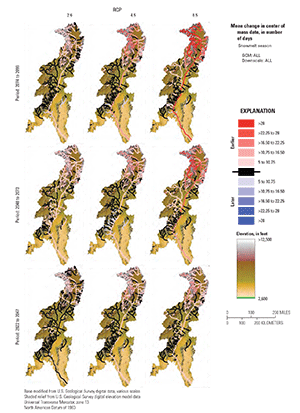
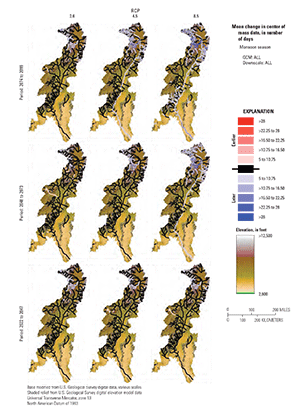
In this study, the calibrated Upper Rio Grande Basin PRMS model (Moeser and others, 2021) was run with projected climate data (Dixon and others, 2020) to produce a set of streamflow projections through the year 2099 that represent potential future changes in Rio Grande streamflow due to changes in climate. The PRMS model was forced with projections of daily precipitation, minimum daily temperature, and maximum daily temperature from 27 datasets for 1981- 2099. These datasets include data generated from three general circulation models (GCM; Table 1) included in the Coupled Model Intercomparison Project phase 5 (CMIP5) suite of models, using three statistical downscaling methods for three RCP scenarios. To arrive at potential climate-induced impacts, simulated streamflow for the model historical period (1981–2015) was subtracted from three simulated future time periods (2022-47,2048-73, 2074-99), and an analysis of changes in [naturalized] streamflow volume and timing was conducted for the Rio Grande and its tributaries.
Table 1. General circulation models, downscaling methods, and representative concentration pathway used to generate projected climate data used to run the Upper Rio Grande Basin PRMS model in Moeser and others, 2021.
| General Circulation Models (GCM) | Downscaling Method | Representative Concentration Pathway (RCP) |
|---|---|---|
| Community Climate System Model version 4 (CCSM4) | Delta method | RCP 2.6 |
| Model for Interdisciplinary Research on Climate version 5 (MIROC5) | Equidistant quantile mapping method | RCP 4.5 |
| Max-Planck-Institute Earth System Model running on a low-resolution grid (MPI-ESM-LR) | Piecewise asynchronous regression method | RCP 8.5 |
In general, downscaled climate projections show consistent increases in temperature across the Upper Rio Grande Basin. The average projected change in total precipitation during the monsoon and snowmelt seasons suggests that, in general, precipitation will decrease during both seasons across the Upper Rio Grande Basin. However, there is considerable spread between individual downscaled climate projections and time periods. With the changes in temperature and precipitation, simulated hydrographs of streamflow and cumulative streamflow volume for streamgages on the main stem Rio Grande and outflow streamgages in near-native subbasins show changes from the historical period (1981–2015) in the magnitude and timing of streamflow for all future time periods and RCP scenarios. In general, changes in streamflow timing at all Rio Grande main stem gages showed shifts in timing of peak flow toward earlier in the year, whereas changes in streamflow timing at gages in near-native subbasins varied by location in the basin. Changes in streamflow volume along the Rio Grande main stem showed a similar trend for all RCPs and time periods where streamflow volume increases at headwater gages (Del Norte and Stateline) and decreases at all other gages below the headwaters. The largest percent differences in streamflow volume between the historical period and the future time periods were not found in the main stem gages but rather in the gages in the near-native subbasins.
Read the Report