California Oil, Gas, and Groundwater Program
Regional Groundwater Sampling Design
Scientists at the USGS with expertise in groundwater and geochemistry design a unique water-quality sampling plan for each study area using information from the salinity mapping and geological context efforts and historical information about subsurface flows and potential areas of contamination.
Conceptual Model
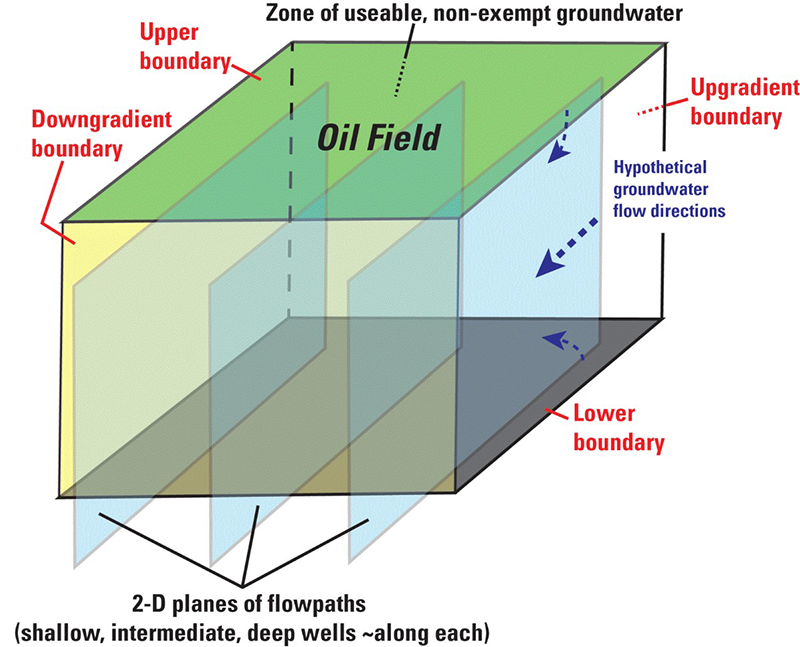
For a given oil field, we use the salinity mapping tools to identify where protected groundwater is. Typically, the upper boundary of that zone would be the water table. In simple cases, the lower boundary of that zone would be a two-dimensional surface defined by the depths at which groundwater salinity increases to 10,000 mg/L TDS.
The goal of the water-quality monitoring is to determine if there is fluid movement from zones where oil and gas production activity is taking place into the zone of protected groundwater.
To accomplish that, we identify various potential flow paths through the oil field that extend from the upgradient boundary through areas of oil field infrastructure and to the downgradient edge of the field and potentially the edge of the buffer zone. The strategy then is to collect groundwater samples from shallow, intermediate, and deep wells at various points along the flow paths.
Example of Conceptual Model Applied to Fruitvale Oil Field
As oil and gas extraction in most fields in California spans from several decades up to more than a century, and as groundwater withdrawn from a well may have entered an aquifer decades to thousands of years before present, the effects of historical practices and natural hydrogeologic setting on groundwater-quality need to be considered in regional monitoring of groundwater-quality near oil fields.
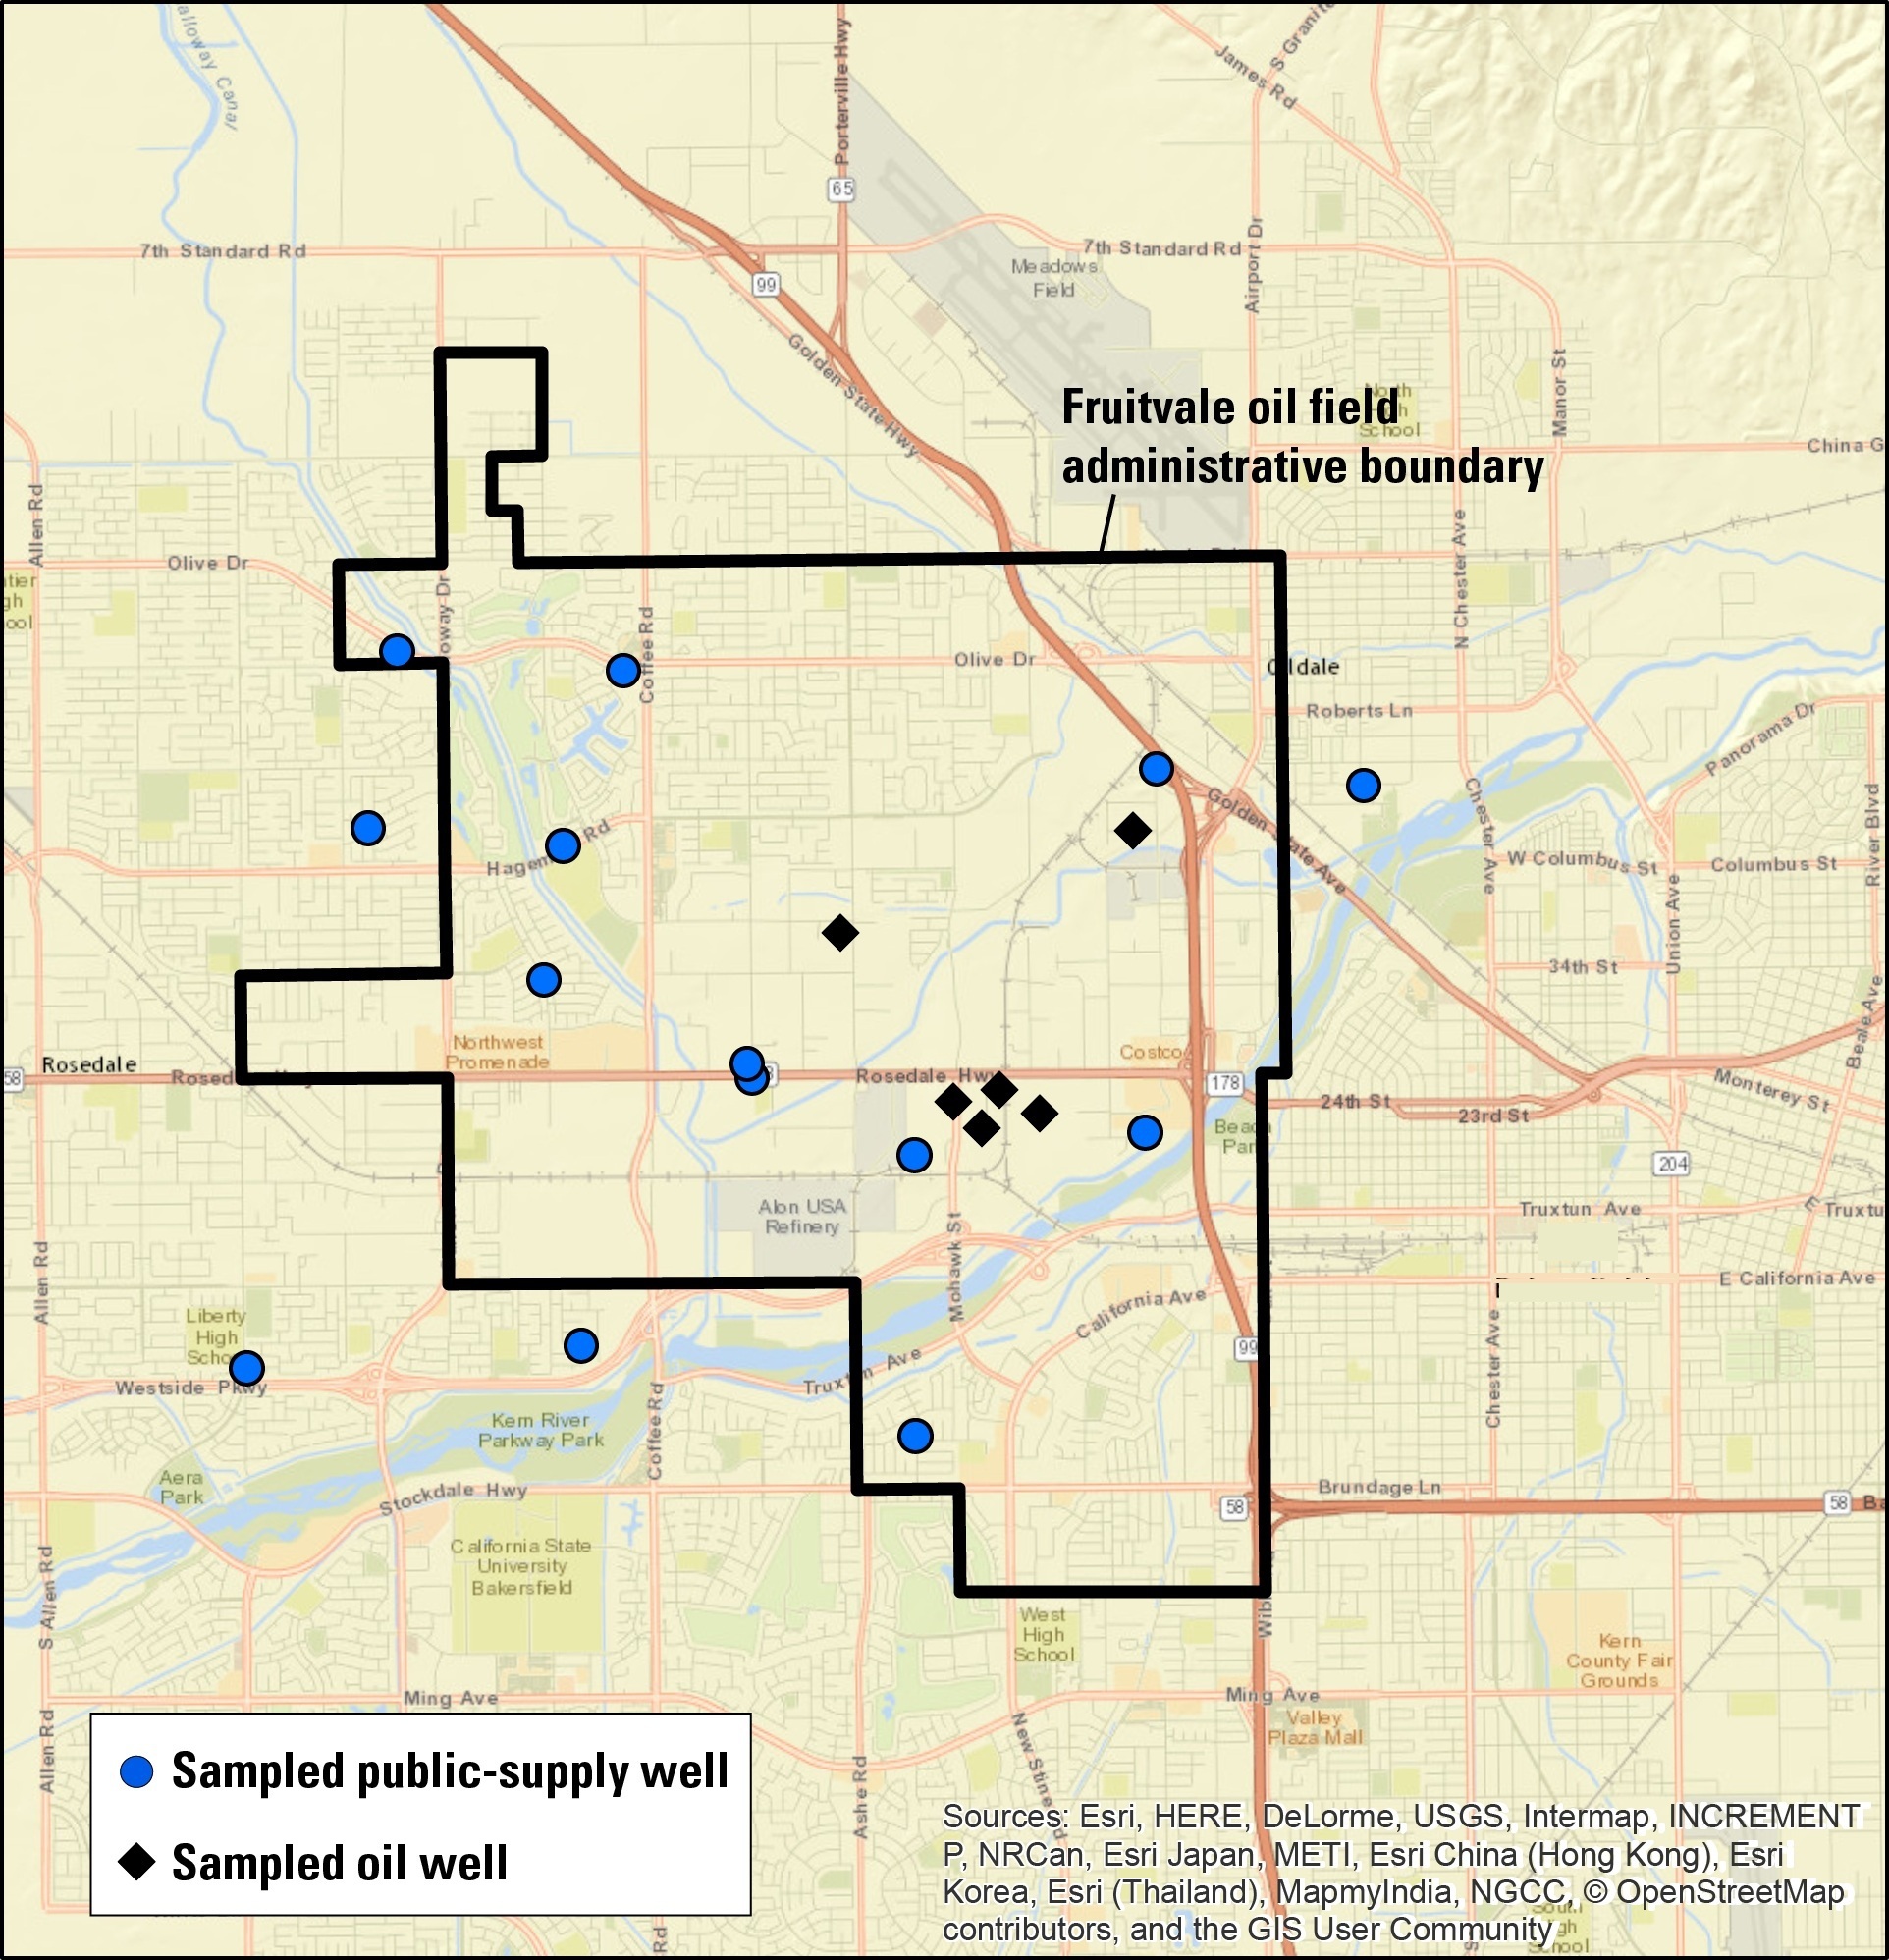
Available TDS data from water well samples within a 5 km buffer of the Fruitvale oil field reveal two things. First, only a few of the samples had TDS values greater than 2,000 mg/L (shown by red dots on the map), so we know there is chiefly fresh water overlying this oil field. Second, there are numerous water supply wells within the oil field boundary and adjacent to it (California Department of Water Resources, 1961; California Department of Water Resources, 2015; California State Water Resources Control Board, 2017).
In the late 1950s, studies by the California Department of Water Resources and the USGS identified a zone of degraded shallow groundwater-quality in the central part of the oil field (in red on the map) where TDS concentrations were over 1,000 mg/L. That zone corresponds to the highest density of oil and gas wells in the field, as well as the area where produced water disposal in unlined sumps occurred historically (indicated by the brown line on the map).
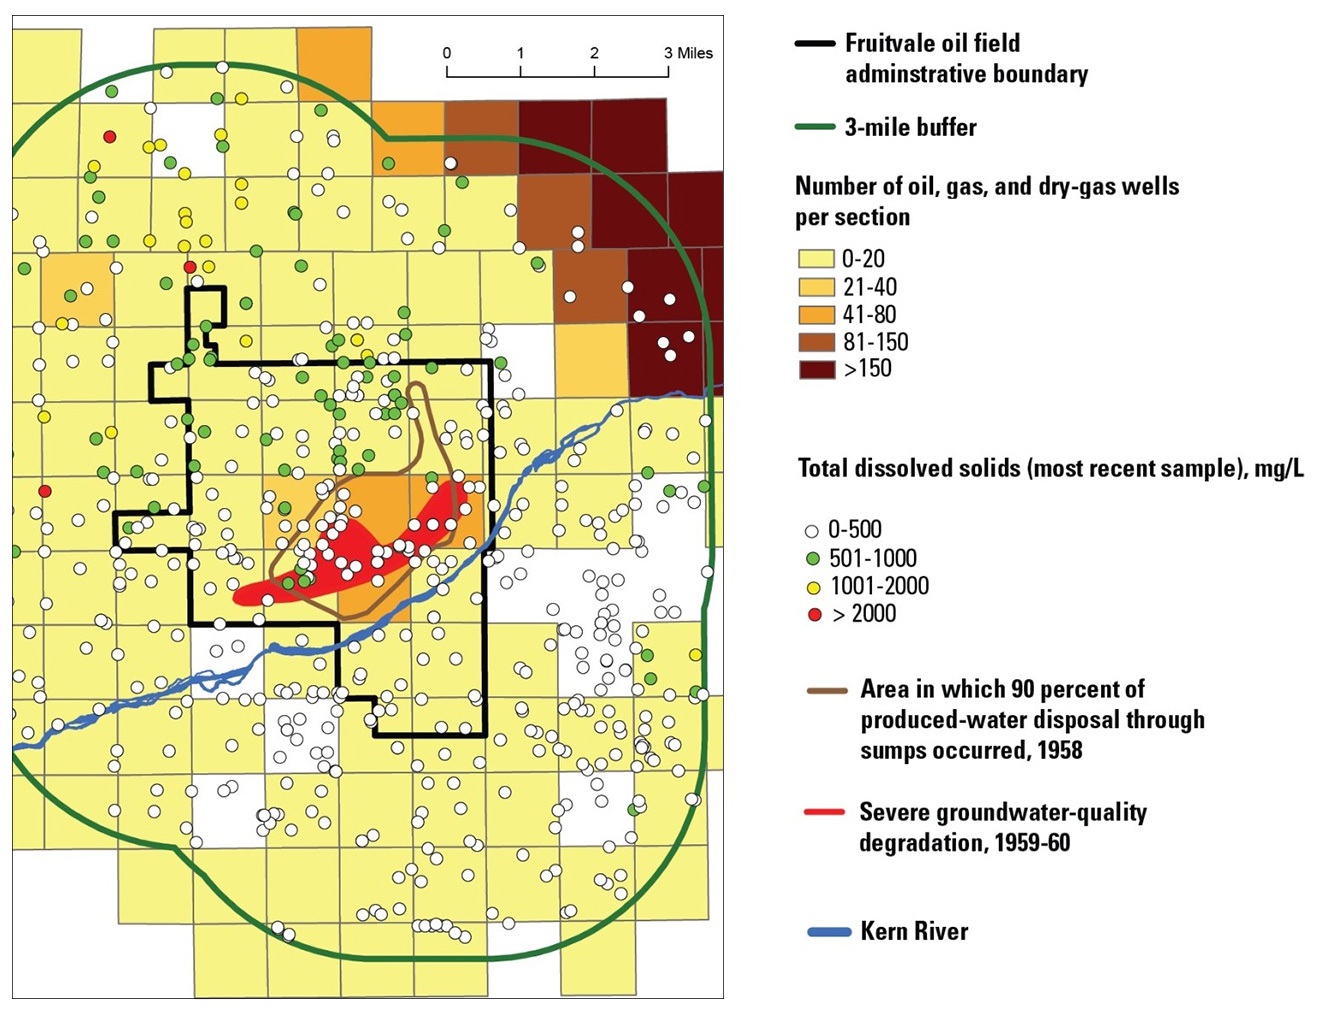
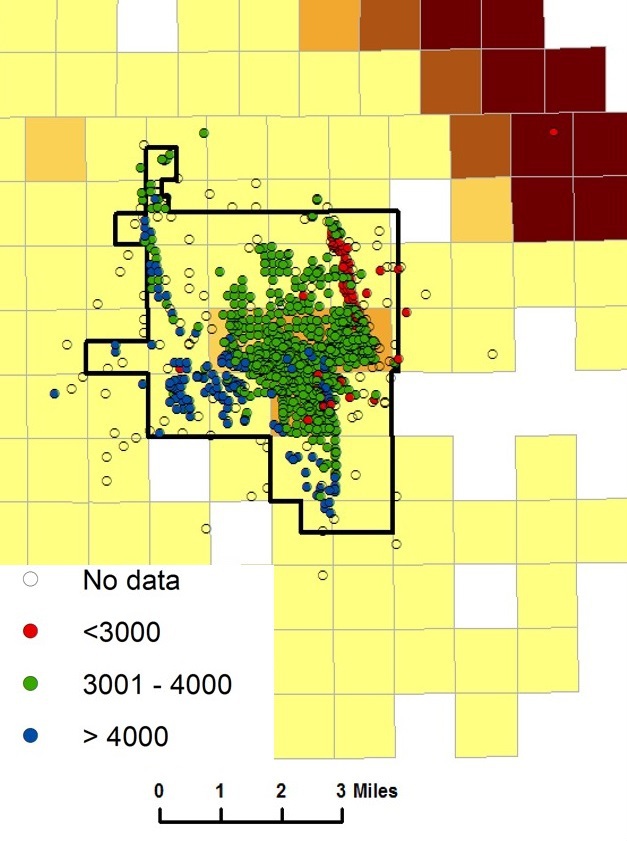
However, water well samples collected from supply wells screened deeper in the aquifer during the 1980s to 2010s generally had TDS concentration less than 1,000 mg/L, and often less than 500 mg/L. These observations may indicate that the degraded water from the pre-1960s has been diluted with fresher recent recharge or has not yet reached the depths of supply wells. Groundwater chemistry, isotopic, and groundwater-age dating data collected by the regional monitoring may help to explain why legacy surface-disposal effects are not generally observed in deeper groundwater used for supply and to distinguish constituents from these legacy surface sources from those potentially moving upwards from oil development zones, if present.
To identify the top of the zone where oil and gas development has been taking place, information about well construction was extracted from the DOGGR well records and recorded in a database. The top perforations of the oil well casings were then used to define the top of that zone. In this oil field, most of the top perforations are between 3,000 ft and 4,000 ft below land surface, but some oil wells have perforations less than 3,000 ft.
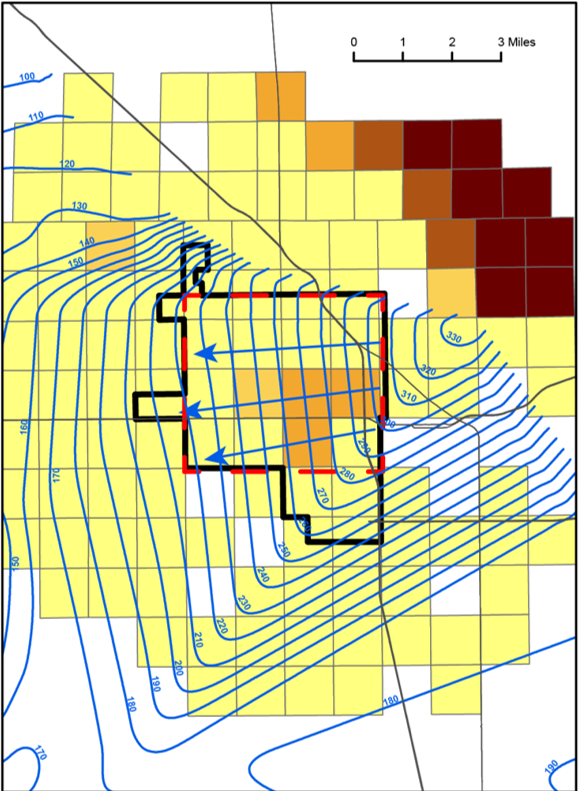
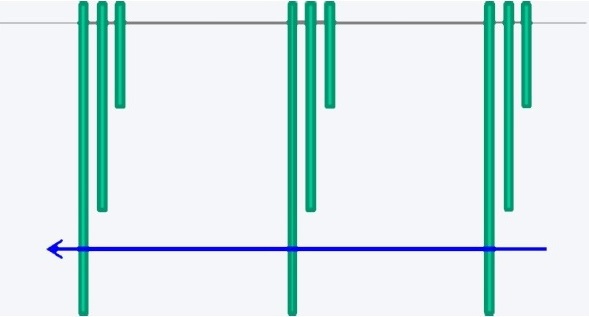
We attempt to arrange sampling of shallow, intermediate, and deep wells along the flowpaths.
Three flowpaths across the system spanning a range of oil infrastructure densities were identified.
Along those flow paths, three target sampling depths were identified based on lithology.
Once the ideal sampling locations have been defined in 3D, COGG team members search for existing wells that could be used to access those points. In some cases, new wells may need to be drilled in subsequent monitoring efforts to fully answer questions about zonal isolation.
Example of Conceptual Model Applied to Lost Hills Oil Field
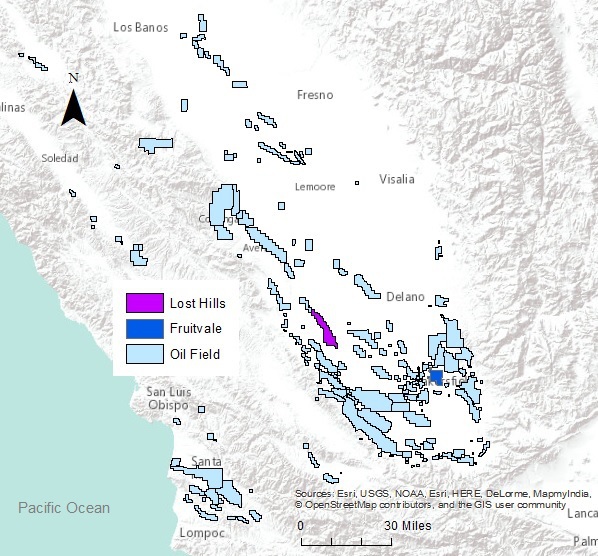
Map of oil field with Lost Hills field highlighted in pink and Fruitvale highlighted in blue.
The Lost Hills oil field on the southwest edge of the San Joaquin Valley has a different physical setting from the Fruitvale oil field on the Valley's east side.
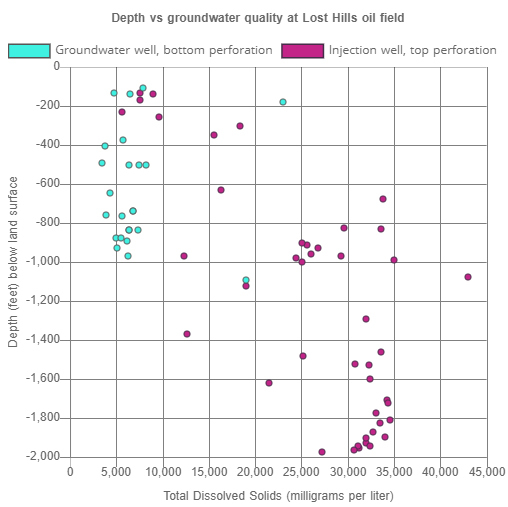
The zone of protected water is only about 1,000 ft deep, and the area is a good example of a field that has both protected and unusable groundwater; the focus of groundwater sampling efforts is thus on those fresher zones and in the buffer area adjacent to the field.
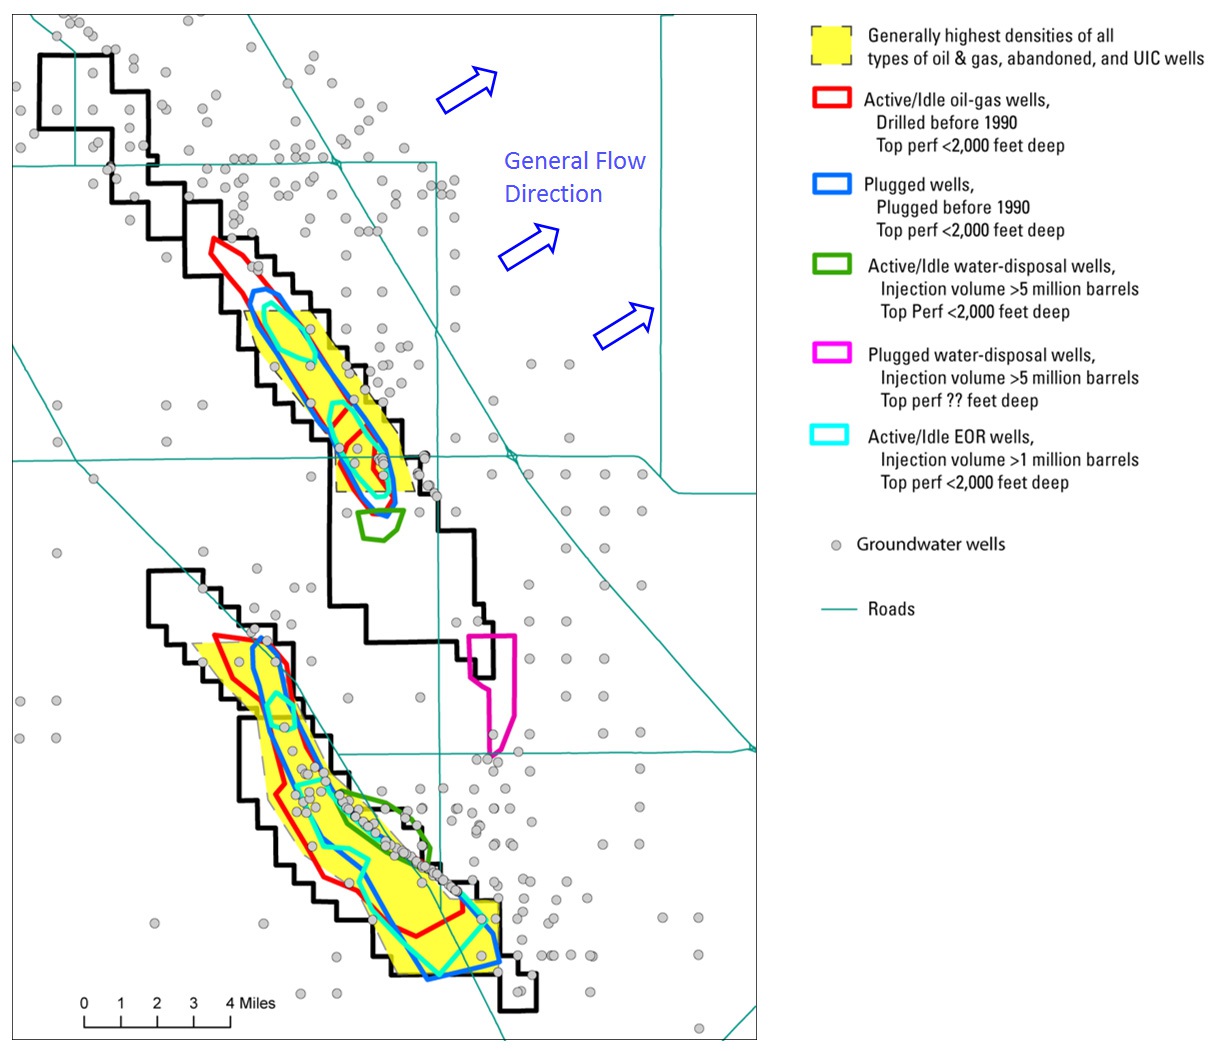
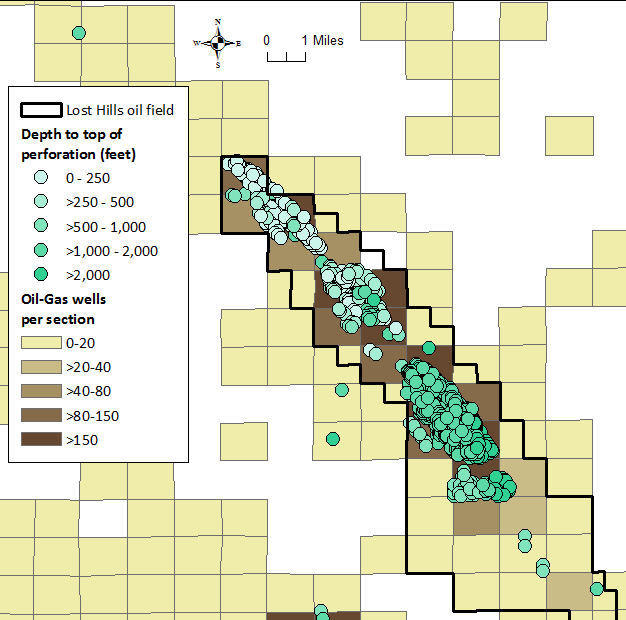
The density of oil and gas wells is very high in the Lost Hills oil field, where the central portion contains more than 150 wells per square mile. In addition, many wells are fairly shallow, having top perforations of well casings less than 1,000 ft deep (DOGGR, 2015).