Results from several COGG studies have been converted into 3D models to allow for better visualization of study results.
Click the "Select" tab to select map layers.
Map Layers
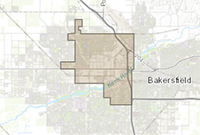
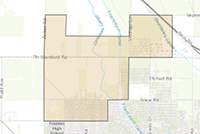
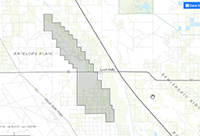
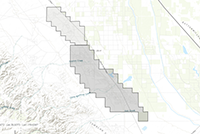
3D Model Boundaries
 |
|
| Depth to the Base of the Tulare Formation | |
| Shallow Groundwater Salinity | |
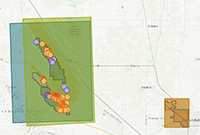
| Subsurface Salinity in the Vicinity of Fruitvale and Rosedale Ranch Oil Fields | |
| Poso Creek Salinity | |
Airborne Electromagnetic Flight Lines
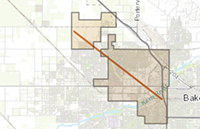
Cross Section Shown Within 3D Model of Fruitvale and Rosedale Ranch Oil Fields
 |
|
| Cross Section | |
Geophysical Log Affected by Disposal Sumps
 |
Geophysical Log Affected by Injection
 |
Fruitvale Oil Field
 |
|
| Oil Field | |
Rosedale Ranch Oil Field
 |
|
| Oil Field | |
Lost Hills Oil Field
 |
|
| Oil Field | |
Belridge Oil Field
 |
|
| Belridge North Oil Field | |
| Belridge South Oil Field | |
Poso Creek Oil and Gas Field
 |
|
| Poso Creek Oil and Gas Field | |
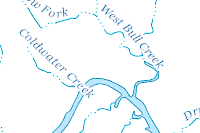
Rivers, Canals, and Other Water Bodies
 |
|
| Waterbody | |
| Stream | |
| Intermittent Stream | |