Integrated Hydrology + Data Science
Hydrologic data in the Tahoe Basin are currently not accessible in one location and are not provided to the public in an easy to understand way. An interactive hydrology mapper is needed to visualize hydrologic data, past and present, to give agencies and the public improved understanding of processes. Visualizations of these data can identify Important hydrologic conditions and variables in the context of stream restoration and lake clarity. Stakeholders need a single repository for easier retrieval, analysis, and interpretation of USGS and NRCS existing data sources as it relates to nutrient and sediment loads into Lake Tahoe.
Build a new content framework and database for updating the existing Lake Tahoe website.
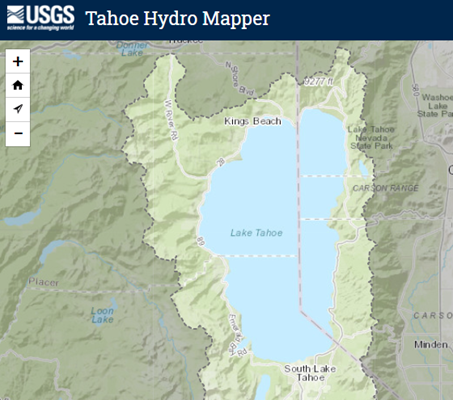
Design and develop a Lake Tahoe Hydromapper:
Build visualization tools for data exploration:
Data Integration
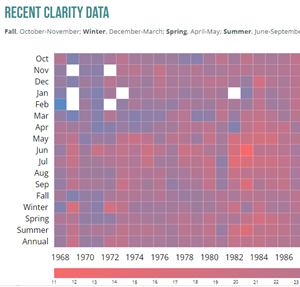
Data Visualization
Javascript Development
UX/UI Design
Web Development
AmCharts
ArcGIS Server
Javascript
Leaflet
SQL Server
Twig