California Oil, Gas, and Groundwater Program
Geochemical Patterns in Oil Field Fluids Vary Dramatically From Field to Field
Manager's summary of McMahon and others (2018)
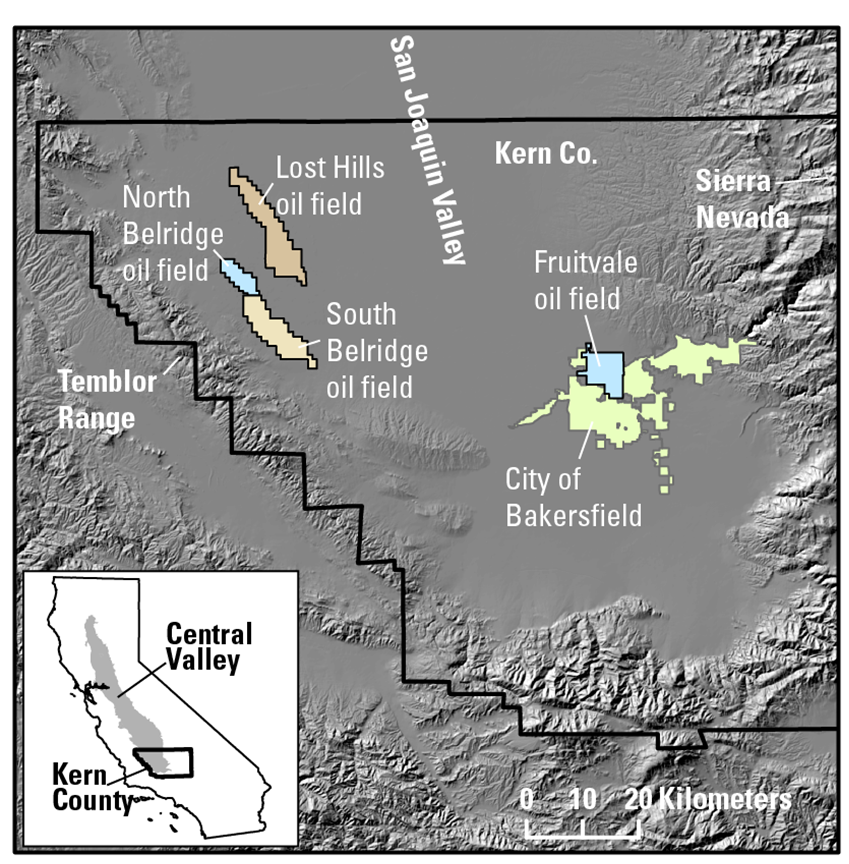
A key objective of COGG is to determine when oil field fluids mix with groundwater. If all oil fields were the same, we could identify a set of tracers that could be consistently used during groundwater sampling. Oil fields, however, differ from each other in many ways including local geological formations, local recharge, history of enhanced recovery with water and/or steam injection, waste disposal, and the source of fluids injected into different systems. This study documents differences and similarities between oil field waters from four fields in Kern County, California: Fruitvale, Lost Hills, and North and South Belridge shown on the map.
Chemical Differences Attributed to Recharge
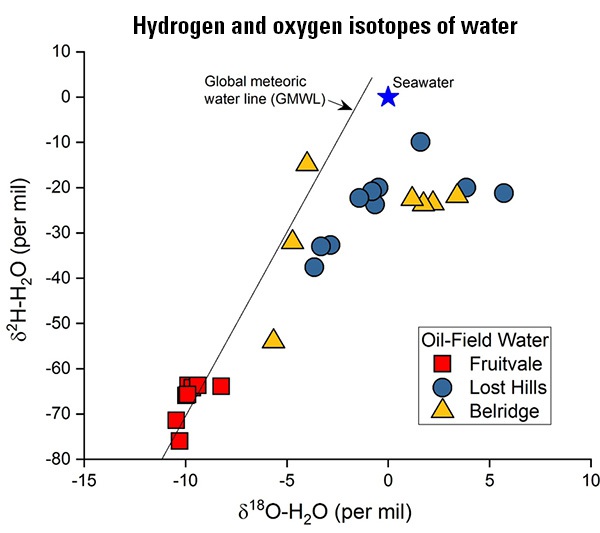
The Fruitvale oil field lies in an area directly influenced by recharge from the Kern River, draining the high altitude Sierra Nevada, while the other three fields on the west side of the San Joaquin Valley are in a much drier, low-recharge environment. Recharge from rain and snowmelt carried into the Valley by the Kern River has an isotopic signature that falls on the indicated global meteoric water line in the figure below. Lost Hills samples lie below the line and Belridge samples show a mixture between native formation waters and rain-derived water.
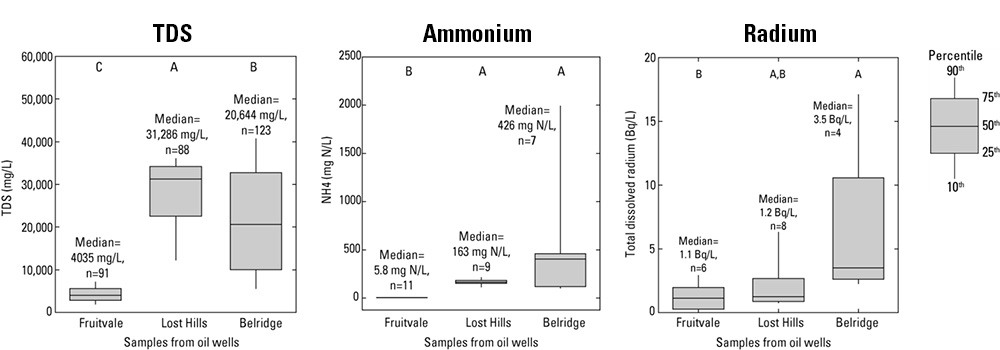
The extensive recharge also dilutes concentrations of many constituents and enhances biodegradation of organic compounds. Compared to Lost Hills and the Belridge fields, Fruitvale oil-field samples have:
lower concentrations of major ions, trace elements, ammonium, and radium
more biodegradation of dissolved organic carbon and hydrocarbon gases.
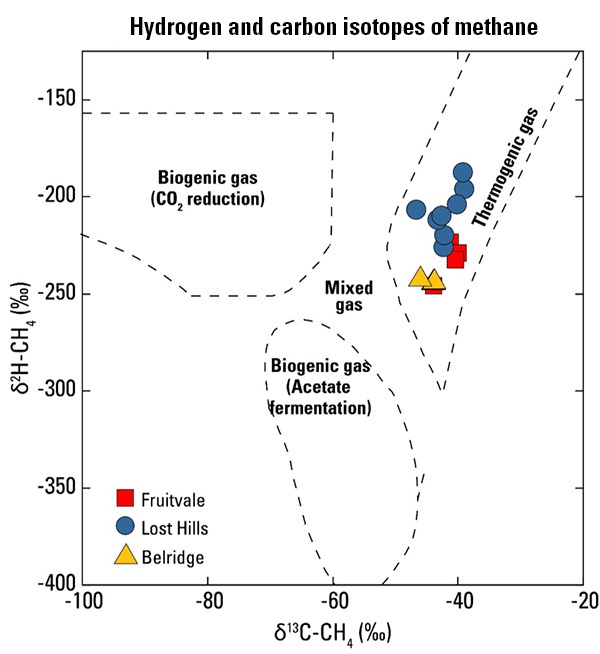
Heat-Formed Methane Common to All Sampled Oil Fields
Heat-formed methane (thermogenic) is a clear indicator of oil-field fluids and can be distinguished from biogenic methane formed by bacteria (microbial) by mapping carbon and hydrogen isotopic ratios.
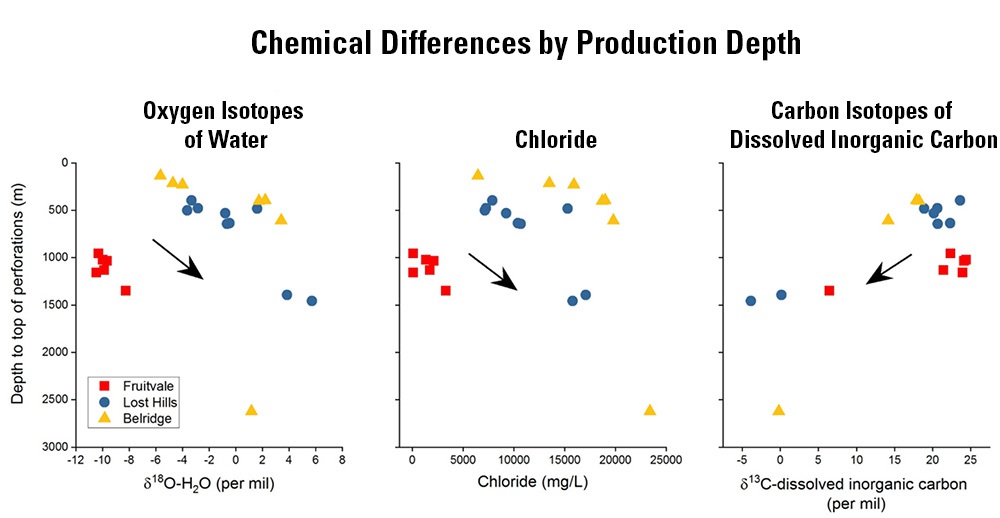
Chemistry Differs by Depth
Samples from all four fields showed consistent patterns in oxygen isotopes of water, concentration of chloride, and carbon isotopes of dissolved inorganic carbon.
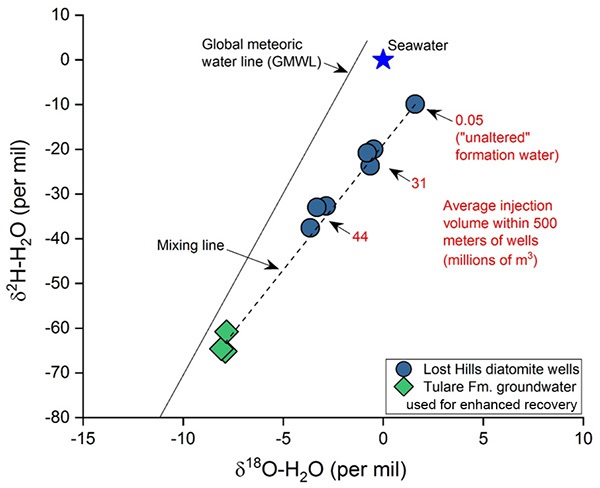
Chemistry of Fluids Around Wells Affected by Injection
The samples from the Lost Hills oil field provide a detailed view of how injected groundwater changes the chemistry around wells.
Samples from the diatomite formation in the Lost Hills oil field show the effect of injecting groundwater into the system for EOR on the chemistry of fluids surrounding wells. Plotting isotopic values of hydrogen in comparison to isotopic values of oxygen in water from these samples reveals a clear mixing line between a sample collected from an area with very little injection (unaltered) through a set of samples taken near 31,000,000 M3 of injected groundwater and a third set taken near 44 million M3 of injected water. The injected Tulare Formation groundwater plots along the same line at the bottom. In other words, formation fluids are diluted by injection of groundwater for enhanced recovery.
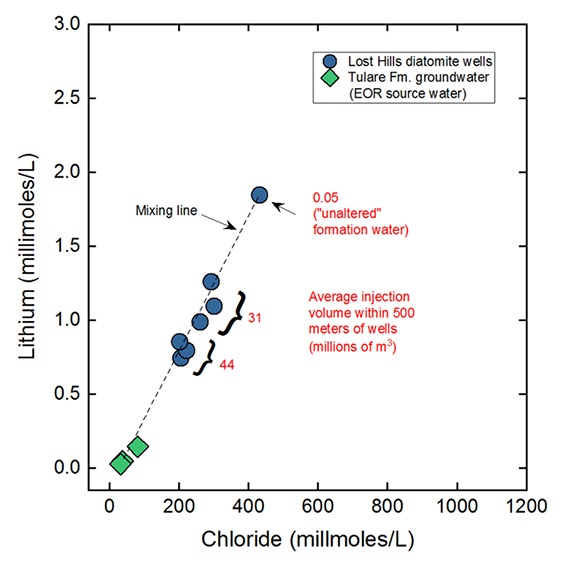
Another line of evidence for dilution is the same type of mixing line is observable when plotting lithium and chloride concentrations from the same samples.
Identifying Injection of Recycled Produced Water
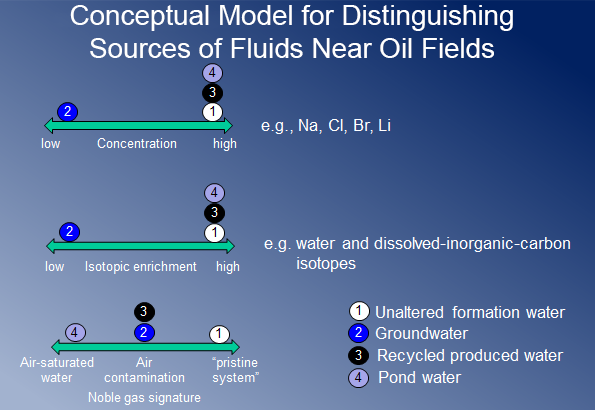
The largest volume of water injected into oil fields is recycled produced water, which may not be chemically and isotopically different from receiving water. Noble gases can help distinguish between fluids that have been exposed to the air (injectate) and fluids that have only migrated through the subsurface.
This diagram shows how different types of constituents can be used to distinguish between unaltered formation water, groundwater, recycled produced water, and fluids seeping from sump ponds.