California Oil, Gas, and Groundwater Program
Monitoring Wells Drilled as part of COGG
Overview
The COGG Program includes drilling new wells when there is no existing infrastructure in a location where more robust information is needed about subsurface conditions between protected groundwater and oil and gas development activities. These sites can yield new insight on vertical profiles of water quality, groundwater flow, aquifer layers that may impede groundwater flow, and changes in aquifer conditions over time in response to recharge and well pumping. These multi-well monitoring sites are expensive and can cost up to $1 million to install, depending on depth, site conditions, and the number of analyses completed during the well installation process. The first two multi-completion monitoring sites were installed in 2018. Data from the Lost Hills site are available online; similar records will soon be available from a site drilled later in 2018 adjacent to the North/South Belridge oil fields.
Geophysical and well construction information for wells drilled by the USGS are published in the USGS GeoLog Locator. Monitoring data from the sites, such as water levels and water quality, are published in the NWISWeb. For multi-completion monitoring wells installed as part of COGG, there will be multiple "sites" at a single location, each representing one of the completed wells.
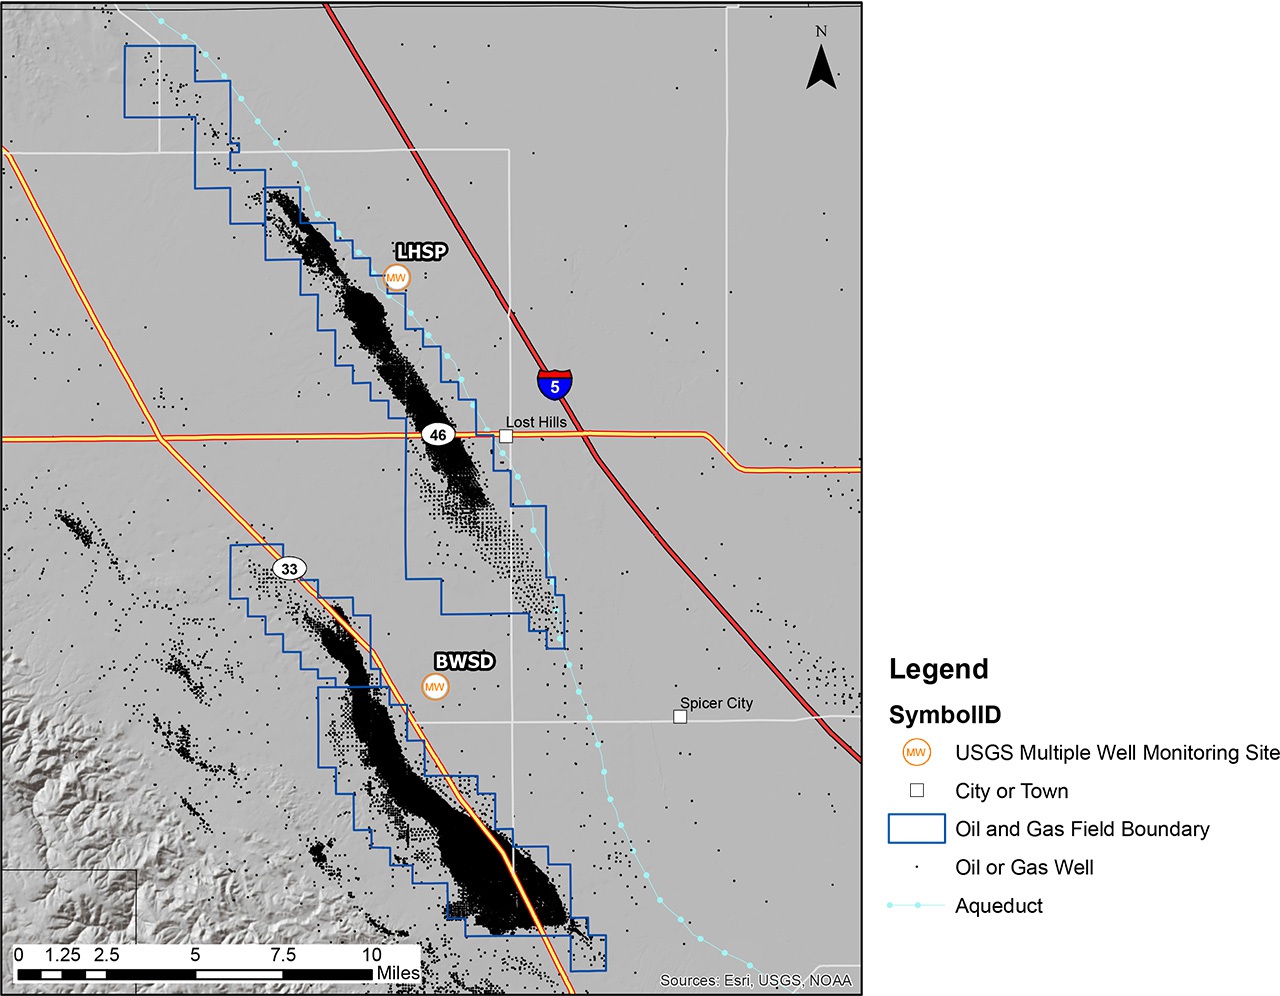
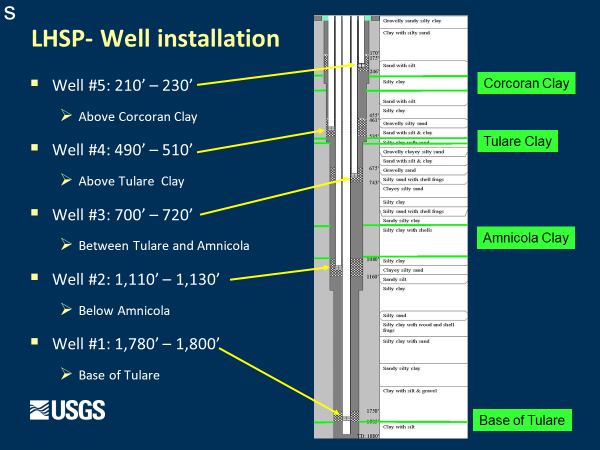
Lost Hills
The LHSP lies about 1700 FT east of the Lost Hills oil field administrative boundary.
The borehole was drilled to 1,860 FT.
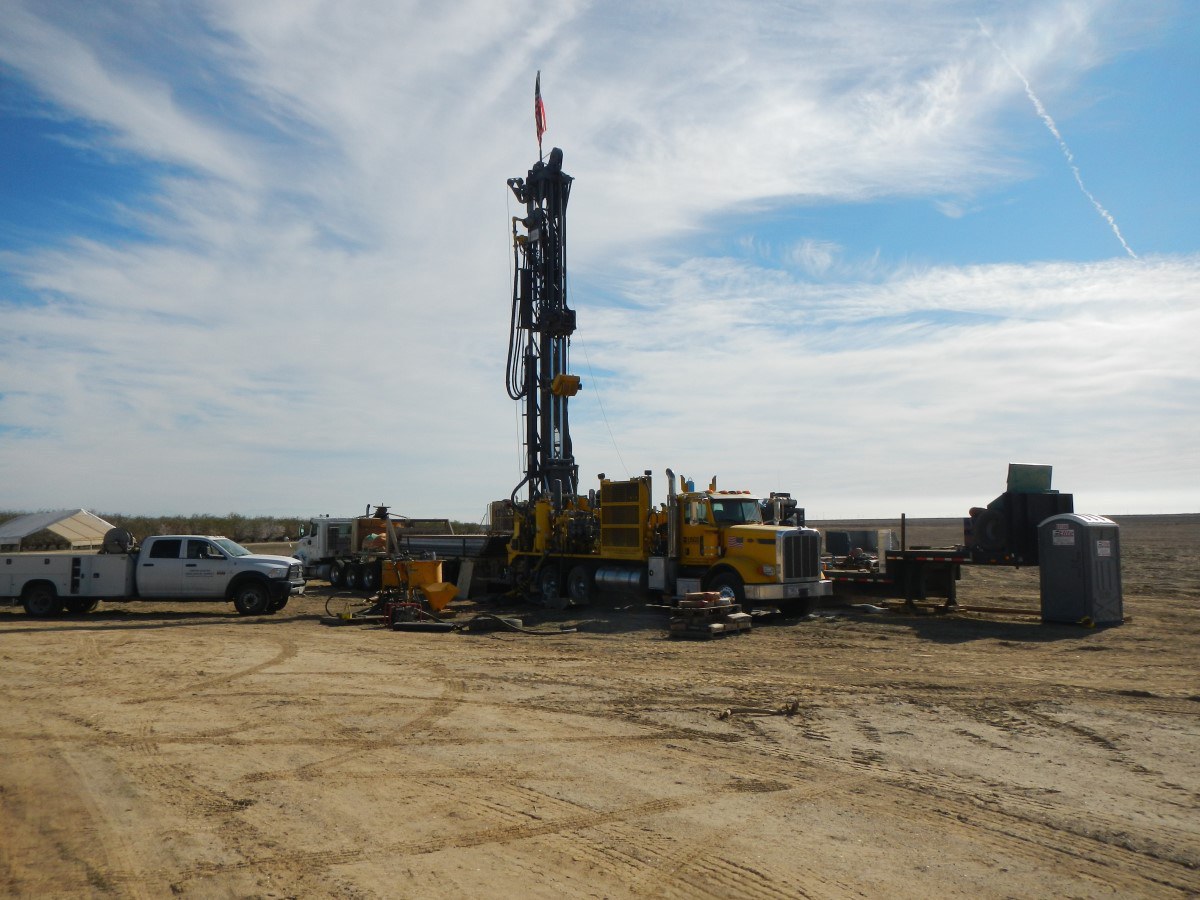
Boreholes at each site were drilled by the USGS Western Region Research Drilling Unit using the mud-rotary method. Borehole diameter decreased with depth, ranging in diameter from 20 to 7-5/8 inches. After total hole depth was attained, geophysical log surveys were completed, and the monitoring wells were installed.
Electrical conductivity of drill mud was monitored.
EC of the drilling mud was monitored every 10 FT during the drilling process. Drill rig operations, such as mixing new mud, that can alter the mud properties were also monitored. EC of the source water, collected from a local hydrant, used for mixing and EC of the fresh drill mud was also noted. Changes in the EC of the drill mud can indicate changes in either the salinity of the native water or the formation encountered at a given depth.
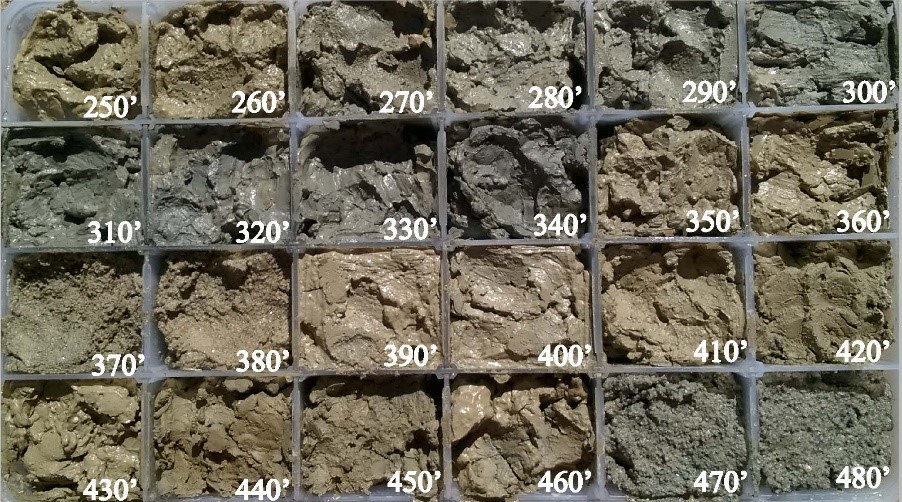
Drill cuttings were collected and described every 10 FT.
Two sets of drill cuttings are collected throughout the drilling process. Cutting samples, denoted as "sieve" were composited along 20-foot drill intervals at the borehole surface using a No. 120 sieve. Cutting samples, denoted as "shaker" were collected at 10-foot intervals and at distinguishable changes in lithology from a No. 60-mesh screen mounted on the drill rig's shaker tank. Detailed lithologic logs were compiled from descriptions of drill cuttings collected at each borehole site and from observations recorded during drilling. Sieve and shaker cuttings are described in the office by grain size, texture, sorting, rounding, color, and any other noticeable features, such as wood or shell fragments. Texture descriptions follow the National Research Council (National Research Council, 1947) grain-size classification. Color, determined on moist samples, follows the numerical color designations in Munsell Soil Color Charts (Munsell Color, 1994). Photos of the drill cuttings and detailed lithologic descriptions are available through the United States Geological Survey GeoLog Locator.
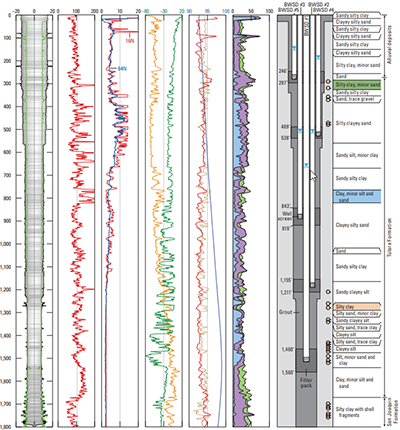
A number of geophysical logs were collected: Caliper, gamma, resistivity, spontaneous potential (SP), EM induction, full wave form sonic, Nuclear Magnetic Resonance (NMR) porosity.
To access this information, click here, close the "Welcome to GeoLog locator" pop-up, select "USGS NWIS Site Numbers" on the left-hand side of the page, enter site ID 354048119445001 and select "Go" select the site (red dot) on the map to view the list of available logs.
To assist in the identification of lithologic and stratigraphic units, geophysical log surveys were completed in the uncased, fluid-filled borehole prior to well construction using techniques described in USGS Techniques of Water-Resources Investigations Reports (Keys and MacCary, 1971; Shuter and Teasdale, 1989; Keys, 1990). Geophysical log surveys run to total borehole depth included caliper, bulk-natural gamma, spontaneous potential, 16- and 64-inch normal resistivity, EM induction, acoustic logs, and nuclear magnetic resonance. Subsequent high-resolution temperature logs and EM logging will be performed in the deepest well at each site to assess if changes in temperature or salinity occur.
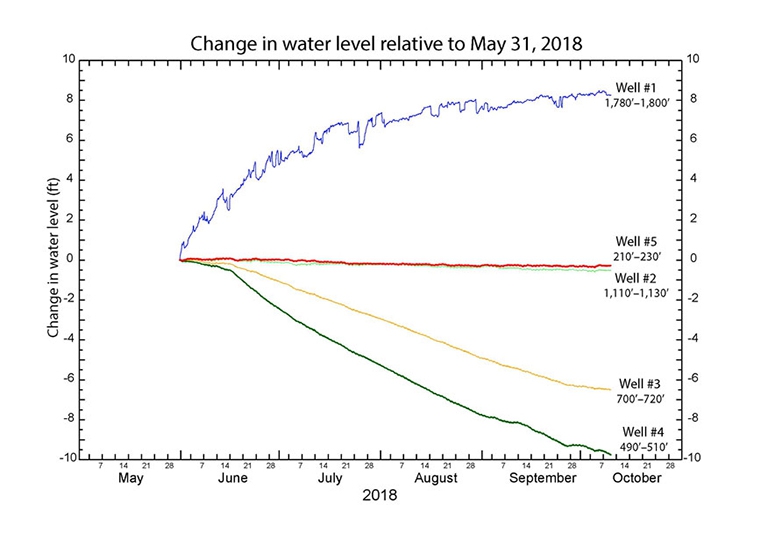
Water level monitoring sensors installed.
Each well is equipped with a pressure transducer and data logger set up to measure water levels (depth to water below land surface), on an hourly basis. Periodic manual measurements of water levels were made to verify the time-series data. The discrete water levels along with the computed unit values, and daily maximum, minimum, and median values for all time-series water-level data for these sites are available through the USGS NWIS Web.
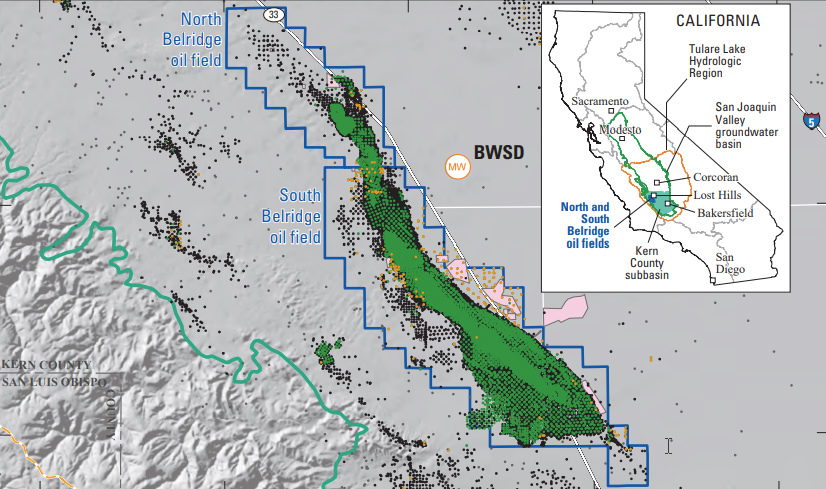
Belridge
USGS installed a multiple-well monitoring site in the southern San Joaquin Valley groundwater basin adjacent to the North and South Belridge oil fields, about 7 miles southwest of Lost Hills, Calif. Data collected at the Belridge multiple-well monitoring site (BWSD) provide information about the geology, hydrology, geophysical properties, and geochemistry of the aquifer system, thus enhancing understanding of relations between adjacent groundwater and the North and South Belridge oil fields in an area where there are few groundwater data.
Everett, R.R., Brown, A.A., Gillespie, J.M., Kjos, A., and Fenton, N.C., 2020, Multiple-well monitoring site adjacent to the North and South Belridge Oil Fields, Kern County, California: U.S. Geological Survey Open-File Report 2020-1116, 10 p., https://doi.org/10.3133/ofr20201116.
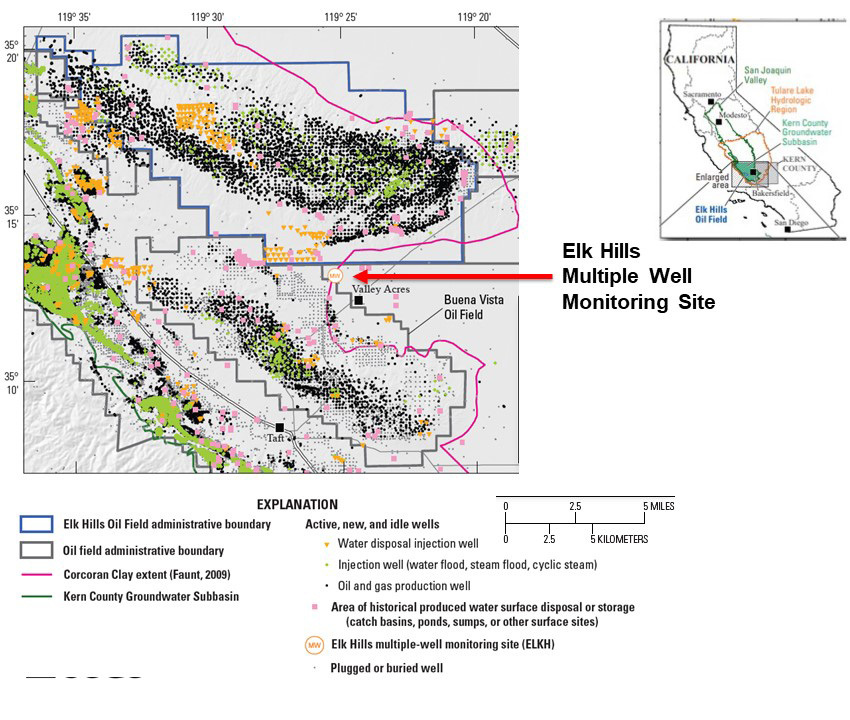
Elk Hills
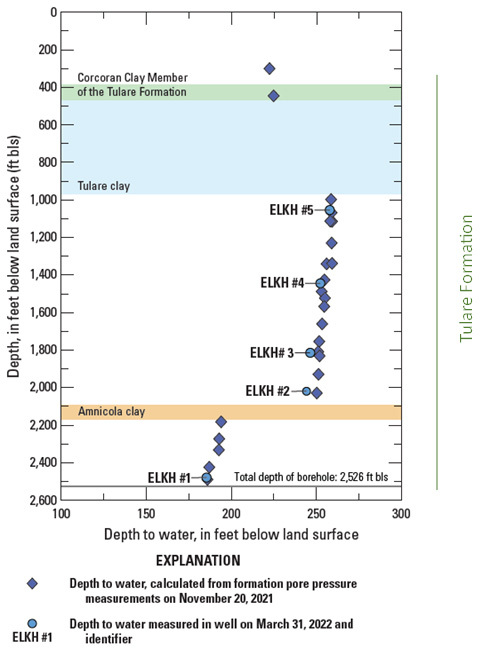
The location for the Elk Hills multiple-well monitoring site was chosen because there is generally little groundwater data adjacent to oil fields on the edge of regional aquifers (Metzger and Landon, 2018). Six wells were installed in a borehole drilled to 2526 feet in 2021. Information on this page summarizes the detailed report by Everett and others (2023).
The location lies near the boundaries of the Elk Hills and Buena Vista Oil Fields. The Tulare aquifer is located east of both fields and is the primary groundwater source for the San Joaquin Valley. At this monitoring location, there is an upward flow gradient in most of the Tulare Formation.
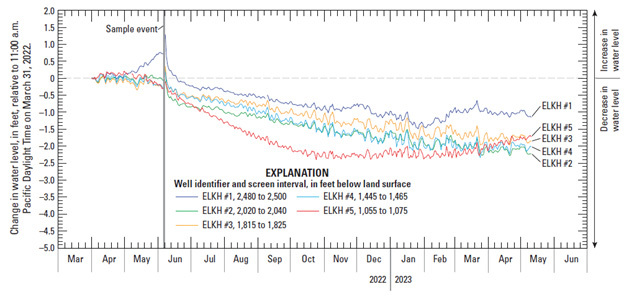
The water levels in five wells show similar changes over time, indicating that stresses are consistent throughout the Tulare Formation at this site.
Poso Creek
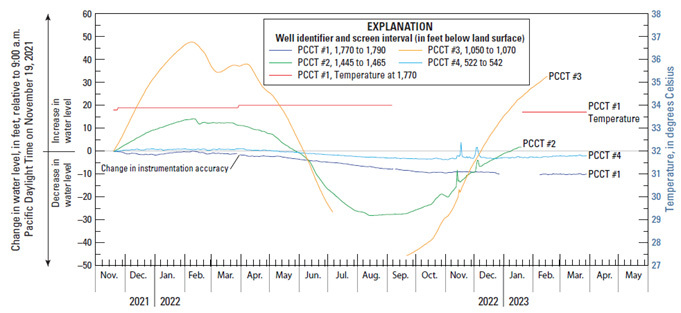
The USGS drilled the Poso Creek multiple well monitoring site (PCCT) in 2021. This page summarizes information in Everett and others (2023)
This location was chosen because there is generally little groundwater data overlying oil fields, particularly at multiple depths (Metzger and Landon, 2018). At Poso Creek, the west Premier fault interrupts the Macoma claystone layer generally thought to confine oil and gas fluids beneath it.
Data from the monitoring wells indicate a downward flow gradient.
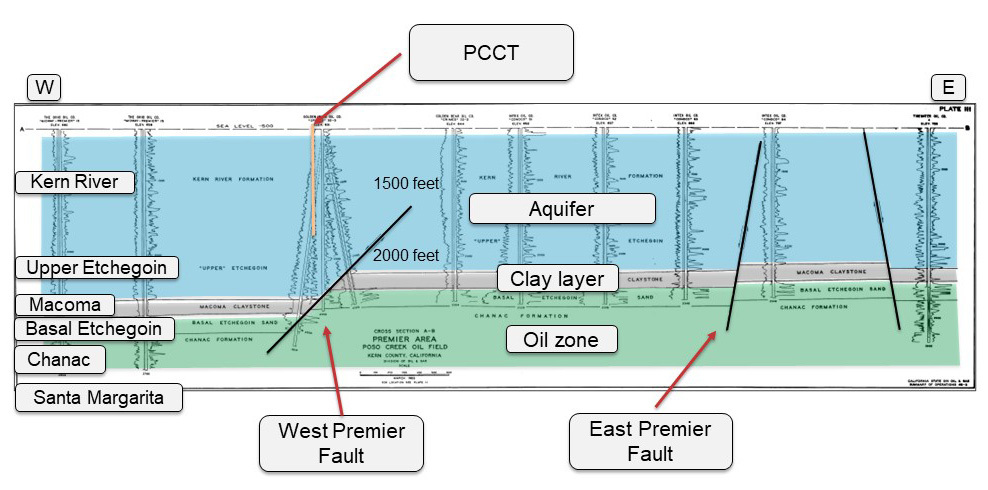
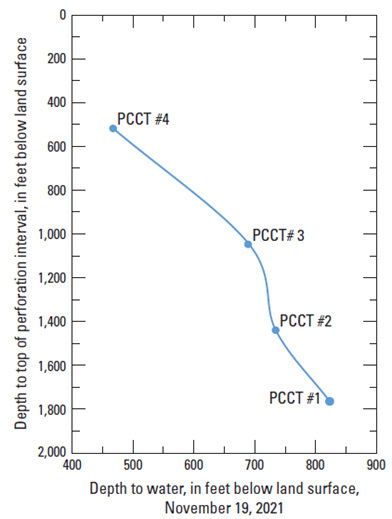
Water level responses in the wells differed over time, indicating connections between aquifer zones are restricted by discontinuous clays.