USGS Lakes

Data Source: USGS Water Data for the Nation
Click points to access real-time data, time-series graphs, and station information.
USGS Lakes |
|---|
|
Data Source: USGS Water Data for the Nation
Click points to access real-time data, time-series graphs, and station information.
|
USGS Streams: Historical Rank |
||
|---|---|---|
| Above flood stage | ||
| All-time high for this day | 100th percentile (maximum) | |
| Much above normal | >90th percentile | |
| Above normal | 76th – 90th percentile | |
| Normal | 25th – 75th percentile | |
| Below normal | 10th – 24th percentile | |
| Much below normal | <10th percentile | |
| All-time low for this day | 0th percentile (minimum) | |
| Not flowing | ||
| Not ranked | ||
| Measurement flag | ||
|
Comments: Marker color indicates the current streamflow condition. Categories are based on the percentile of existing streamflow record on this day-of-the-year. A streamgage is not ranked when there is less than 10 years of record or a current streamflow measurement is unavailable. Flood stages are maintained by the National Weather Service (NWS) and are not established for all USGS streamgages. Data Source: USGS Water Data for the Nation
Click points to access real-time data, time-series graphs, and station information.
|
||
USGS Streams: Flow |
|
|---|---|
| 0 cubic feet per second (not flowing) | |
| > 0 – 10 cubic feet per second | |
| > 10 – 100 cubic feet per second | |
| > 100 – 1,000 cubic feet per second | |
| > 1,000 cubic feet per second | |
|
Comments: Markers are labeled with the most recently measured real-time streamflow value, in cubic feet per second. Data Source: USGS Water Data for the Nation
Click points to access real-time data, time-series graphs, and station information.
|
|
USGS Streams: Rate of Change |
|
|---|---|
| Stream stage rising ≥ 1 foot/hour | |
| Stream stage rising ≥ 0.5 – 1 foot/hour | |
| Stream stage rising ≥ 0.05 – 0.5 foot/hour | |
| Stream stage changing < 0.05 foot/hour | |
| Stream stage falling ≥ 0.05 – 0.5 foot/hour | |
| Stream stage falling ≥ 0.5 – 1 foot/hour | |
| Stream stage falling ≥ 1 foot/hour | |
|
Comments: Rate of change is computed by subtracting the two most recent measurements divided by the elapsed time and converting to feet per hour. Data at most stations are collected at 15 minute intervals. Data Source: USGS Water Data for the Nation
Click points to access real-time data, time-series graphs, and station information.
|
|
USGS Streams: NWS Flood Stage |
|
|---|---|
| Station with NWS-assigned flood stage, currently below flood stage | |
| Station with NWS-assigned flood stage, currently above flood stage | |
| Station without NWS-assigned flood stage | |
|
Comments: The National Weather Service (NWS) uses selected USGS stream stations for river forecasts. These stations have a flood stage assigned by the NWS. NWS river forecasts can be accessed here. Data Source: USGS Water Data for the Nation
Click points to access real-time data, time-series graphs, and station information.
|
|
USGS Water Quality Stations |
|
|---|---|
| USGS station collecting real-time water quality data | |
|
Data Source: USGS Water Data for the Nation
Click points to access real-time data, time-series graphs, and station information.
|
|
USGS Atmospheric Stations |
||
|---|---|---|
| None | 0 inches/hour | |
| Light | > 0 – 0.1 inches/hour | |
| Moderate | > 0.1 – 0.4 inches/hour | |
| Heavy | > 0.4 – 2.0 inches/hour | |
| Violent | > 2.0 – 4.0 inches/hour | |
| Extreme | > 4.0 inches/hour | |
|
Comments: Marker color is based on the most recent rainfall rate observed at the station. Data Source: USGS Water Data for the Nation
Click points to access real-time data, time-series graphs, and station information.
|
||
NRCS Snow Telemetry (SNOTEL): Snow Water Equivalent |
|
|---|---|
| 0 inch | > 25 – 31.25 inch |
| > 0 – 6.25 inch | > 31.25 – 37.5 inch |
| > 6.25 – 12.5 inch | > 37.5 – 43.75 inch |
| > 12.5 – 18.75 inch | > 43.75 – 50 inch |
| > 18.75 – 25 inch | > 50 inch |
| No value | |
|
Comments: Snow water equivalent (SWE) measures the amount of water contained in snowpack. It can be considered as the depth of water that would theoretically result if the entire snowpack instantaneously melts. SWE depends on both snow depth and density. Data Source: USDA Natural Resources Conservation Service (NRCS)
Click points to access data, graphs, and station information.
|
|
NRCS Snow Telemetry (SNOTEL): Median Snow Water Equivalent |
|
|---|---|
| 0 inch | > 25 – 31.25 inch |
| > 0 – 6.25 inch | > 31.25 – 37.5 inch |
| > 6.25 – 12.5 inch | > 37.5 – 43.75 inch |
| > 12.5 – 18.75 inch | > 43.75 – 50 inch |
| > 18.75 – 25 inch | > 50 inch |
| No value | |
|
Comments: The median of all snow water equivalent values for this day-of-year. Presented value is the official NRCS 30-year Median updated every 10 years. Data Source: USDA Natural Resources Conservation Service (NRCS)
Click points to access data, graphs, and station information.
|
|
NRCS Snow Telemetry (SNOTEL): Snow Water Equivalent, Percent of Median |
|
|---|---|
| 0% | > 100 – 125% |
| > 0 – 25% | > 125 – 150% |
| > 25 – 50% | > 150 – 175% |
| > 50 – 75% | > 175 – 200% |
| > 75 – 100% | > 200% |
| No value | |
|
Comments: The observed snow water equivalent divided by the median of all snow water equivalent values for this day-of-year, expressed as a percent. The "No value" symbol is shown when the median is zero. Data Source: USDA Natural Resources Conservation Service (NRCS)
Click points to access data, graphs, and station information.
|
|
NRCS Snow Telemetry (SNOTEL): Snow Water Equivalent, Percent of Median for April 1st |
|
|---|---|
| 0% | > 100 – 125% |
| > 0 – 25% | > 125 – 150% |
| > 25 – 50% | > 150 – 175% |
| > 50 – 75% | > 175 – 200% |
| > 75 – 100% | > 200% |
| No value | |
|
Comments: The observed snow water equivalent divided by the official NRCS 30-year median for April 1st, expressed as a percent. April 1st is frequently used as the snow water equivalent benchmark for allocation decisions and water forecasting. The "No value" symbol is shown when the median for April 1st is zero. Data Source: USDA Natural Resources Conservation Service (NRCS)
Click points to access data, graphs, and station information.
|
|
NRCS Snow Telemetry (SNOTEL): Snow Depth |
|
|---|---|
| 0 in | > 75 – 93.75 in |
| > 0 – 18.75 in | > 93.75 – 112.5 in |
| > 18.75 – 37.5 in | > 112.5 – 131.25 in |
| > 37.5 – 56.25 in | > 131.25 – 150 in |
| > 56.25 – 75 in | > 150 in |
| No value | |
|
Data Source: USDA Natural Resources Conservation Service (NRCS)
Click points to access data, graphs, and station information.
|
|
Watches, Warnings, and Advisories |
|||
|---|---|---|---|
 |
|||
| Warning | Statement | ||
| Watch | Other | ||
| Advisory | |||
|
Comments: A watch indicates that conditions are favorable for the particular weather event in and near the Watch area and may pose a risk to life and property. A warning or advisory indicates that a particular weather event is imminent or occurring. An advisory is issued if the weather event will lead to nuisance conditions, while a warning is issued for significant weather events which will pose a risk to life and property. More information. Data Source: National Weather Service (NWS)
Click areas to view event details and access the National Weather Service report.
|
|||
Radar |
||
|---|---|---|
 |
||
| 20 dBZ | Trace amounts of precipitation | |
| 30 dBZ | Approx. 0.1 inch/hour | |
| 36 dBZ | Approx. 0.25 inch/hour | |
| 41 dBZ | Approx. 0.5 inch/hour | |
| 47 dBZ | Approx. 1.25 inch/hour | |
| 52 dBZ | Approx. 2.5 inch/hour | |
| 55 dBZ | Approx. 4 inch/hour | |
| 60 dBZ | Approx. 8 inch/hour | |
| 65 dBZ | Approx. 16 inch/hour or more | |
|
Comments: Weather radar measures base reflectivity (dBZ) and does not directly measure actual precipitation. Precipitation rates stated above are provided as rough estimates only. Data Source: Iowa Environmental Mesonet (IEM) |
||
Recent Precipitation |
|||
|---|---|---|---|
 |
|||
| 1 inch | 6 inches | ||
| 2 inches | 7 inches | ||
| 3 inches | 8 inches | ||
| 4 inches | 9 inches | ||
| 5 inches | |||
|
Comments: Values represent estimated accumulated precipitation over the specified time interval. Data Source: Iowa Environmental Mesonet (IEM) |
|||
Recent Precipitation |
|||
|---|---|---|---|
 |
|||
| 0.25 inches | 4 inches | ||
| 0.5 inches | 5 inches | ||
| 0.75 inches | 7 inches | ||
| 1 inch | 10 inches | ||
| 2 inches | 15 inches | ||
| 3 inches | |||
|
Comments: Values represent estimated accumulated precipitation over the specified time interval. Data Source: Iowa Environmental Mesonet (IEM) |
|||
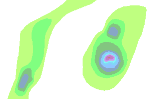
Rainfall Forecast |
|||
|---|---|---|---|
 |
|||
| 0.01 inches | 2.00 inches | ||
| 0.10 inches | 2.50 inches | ||
| 0.25 inches | 3.00 inches | ||
| 0.50 inches | 4.00 inches | ||
| 0.75 inches | 5.00 inches | ||
| 1.00 inches | 7.00 inches | ||
| 1.25 inches | 10.00 inches | ||
| 1.50 inches | 15.00 inches | ||
| 1.75 inches | 20.00 inches | ||
|
Comments: Values are Quantitative Precipitation Forecasts (QPFs) defined as the amount of liquid precipitation expected to fall in a defined period of time. QPFs are estimated as areal averages on a 20- by 20-kilometer grid. Data Source: National Weather Service (NWS) |
|||
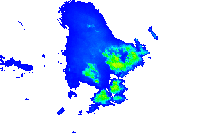
Snow Water Equivalent |
|||
|---|---|---|---|
 |
|||
| 0.04 inches | 5.90 inches | ||
| 0.20 inches | 9.80 inches | ||
| 0.39 inches | 20 inches | ||
| 0.98 inches | 30 inches | ||
| 2.00 inches | 39 inches | ||
| 3.90 inches | 79 inches | ||
|
Comments: Daily ground-based, airborne, and satellite snow observations, along with modeled snowpack estimates, are used to generate the daily NOAA National Snow Analyses (NSA) depicted in this map layer. More information. Data Source: National Weather Service - National Operational Hydrologic Remote Sensing Center (NOHRSC) |
|||
Snow Depth |
|||
|---|---|---|---|
 |
|||
| ≤ 1 inch | 39 – 59 inches | ||
| 1.0 – 2.0 inches | 59 – 98 inches | ||
| 2.0 – 3.9 inches | 98 – 197 inches | ||
| 3.9 – 9.8 inches | 197 – 295 inches | ||
| 9.8 – 20 inches | 295 – 394 inches | ||
| 20 – 39 inches | 394 – 787 inches | ||
|
Comments: Daily ground-based, airborne, and satellite snow observations, along with modeled snowpack estimates, are used to generate the daily NOAA National Snow Analyses (NSA) depicted in this map layer. More information. Data Source: National Weather Service - National Operational Hydrologic Remote Sensing Center (NOHRSC) |
|||
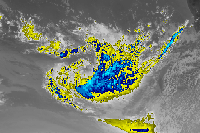
Cloud Cover: Visible |
|---|

Comments: A global composite of visible-spectrum imagery from multiple satellites that is updated each hour. The visible spectrum (0.4 to 1.1µm) depicts high reflectance objects (such as clouds and snow) as white, while low reflectance objects (such as the earth's surface) is dark grey or black. Only available during daylight times. Data Source: University of Wisconsin-Madison RealEarth™ |
Cloud Cover: Infrared (Grayscale) |
|---|

Comments: A global composite of infrared imagery from multiple satellites that is updated each hour. The infrared spectrum (10 to 12µm) depicts heat energy, where colder objects (such as higher cloud tops) are white and warmer objects (such as lower cloud layers) are shades of gray or black. Data Source: University of Wisconsin-Madison RealEarth™ |
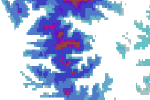
Cloud Cover: Infrared (Color) |
|||
|---|---|---|---|
 |
|||
| < -80 °C | -40 to -20 °C | ||
| -60 to -50 °C | -20 to 0 °C | ||
| -50 to -40 °C | > 0 °C | ||
|
Comments: A global composite of infrared (10 to 12µm) imagery from multiple satellites that is updated each hour. The imagery is color enhanced to increase the contrast of colder (higher altitude) features. Data Source: University of Wisconsin-Madison RealEarth™ |
|||
Cloud Cover: Water Vapor (Grayscale) |
|---|

Comments: A global composite of water vapor (6.7µm) imagery from multiple satellites that is updated each hour. Typically, white indicates a moist layer or clouds in the upper troposphere, while shades of gray or black indicate the Earth or a dry layer in the middle troposphere. Data Source: University of Wisconsin-Madison RealEarth™ |
Cloud Cover: Water Vapor (Color) |
|---|

Comments: A global composite of water vapor (6.7µm) imagery from multiple satellites that is updated each hour. The imagery is color enhanced to increase feature contrast. Data Source: University of Wisconsin-Madison RealEarth™ |
Drought Conditions |
|
|---|---|
 |
|
| Abnormally Dry | |
| Moderate Drought | |
| Severe Drought | |
| Extreme Drought | |
| Exceptional Drought | |
|
Comments: Reported conditions are updated weekly and are based on a composite index that includes many indicators. The U.S. Drought Monitor is jointly produced by the National Drought Mitigation Center at the University of Nebraska-Lincoln, the United States Department of Agriculture, and the National Oceanic and Atmospheric Administration. Map courtesy of NDMC-UNL. More information. Data Source: U.S. Drought Monitor |
|
Rivers |
|
|---|---|
 |
|
| Stream | |
| Intermittent Stream | |
|
Comments: Depicts the National Hydrography Dataset (NHD) that encodes information about naturally occurring and constructed bodies of surface water (lakes, ponds, and reservoirs) and paths through which water flows (canals, ditches, streams, and rivers). Data Source: USGS Texas Water Science Center |
|
Watersheds |
|
|---|---|
 |
|
| Watershed boundary | |
|
Comments: Watershed boundaries are determined by hydrologic units. Zooming the map out shows more generalized (regional) watersheds while zooming the map in shows more detailed (local) watersheds. Data Source: USGS National Water Information System: Mapper |
|
Base Map: Topographic |
|---|

Comments: This base map includes administrative boundaries, cities, water features, physiographic features, parks, landmarks, highways, roads, railways, and airports. Data Source: ESRI ArcGIS Online |
Base Map: Imagery |
|---|

Comments: This base map provides 0.3-meter-resolution satellite and aerial imagery in the continental United States. Data Source: ESRI ArcGIS Online |
Base Map: Streets |
|---|

Comments: This base map is an open-srouce product built by a community of mappers that contribute and maintain data about roads, trails, cafes, railway stations, and much more all over the world. Data Source: OpenStreetMap |
Base Map: Terrain |
|---|

Comments: This base map includes hill shading, borders, and places. Data Source: ESRI ArcGIS Online |
Base Map: Light |
|---|

Comments: This base map provides a light, neutral background with minimal colors, labels, and features to give primary focus to the data layer content. Data Source: Carto |
Base Map: Dark |
|---|

Comments: This base map provides a dark, neutral background with minimal colors, labels, and features to give primary focus to the data layer content. Data Source: Carto |