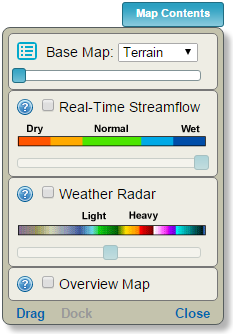
Clicking the map contents button in the upper-right corner of the Streamer map shows or hides the map contents panel. The map contents panel contains controls for changing the base map and displaying additional data layers in the map.

A terrain or imagery base map can be selected from the base map menu.
Clicking the list icon ( ![]() ) to the left of the menu will show or hide the legend for the currently displayed
base map.
The base map legends can also be found on the map legends tab of the help documentation.
) to the left of the menu will show or hide the legend for the currently displayed
base map.
The base map legends can also be found on the map legends tab of the help documentation.
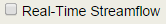
Checking or unchecking the real-time streamflow check box shows or hides the real-time streamflow map layer.
Clicking the question mark icon ( ![]() ) to the left of the check box or clicking on the legend image below the
check box opens this help documentation.
) to the left of the check box or clicking on the legend image below the
check box opens this help documentation.
Real-time streamflow conditions for Streamer stream gages are obtained from USGS Water Data for the Nation. A current streamflow condition is assigned for long-term USGS sites that have 10 years or more of streamflow record. A percentile is computed for the current streamflow with respect to the mean daily streamflow for all available records on the same day of the year. The percentile is used to symbolize the stream gage point shown on the map as follows:
| Map Symbol | Day-of-Year Percentile Range | Current Streamflow Condition |
|---|---|---|
| 90 – 100 | Much above normal | |
| 75 – 90 | Above normal | |
| 25 – 75 | Normal | |
| 10 – 25 | Below normal | |
| 0 – 10 | Much below normal | |
| Not ranked (reasons may include less than 10 years of historical record, a current measurement is not available, the stream is not flowing, or the stream has reversible flow) |
When real-time gages are shown on the map, clicking the identify map tool and then clicking a real-time stream gage symbol displays a popup similar to the following:
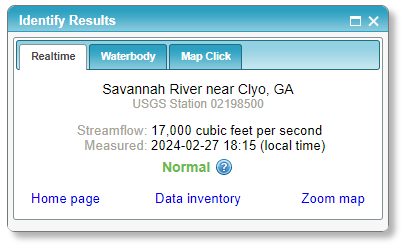
The station number and name is displayed at the top of the popup window followed by the measurement value and date ("N/A" when unavailable). The current streamflow condition is also provided. Click the station's home page and data inventory links at the bottom to explore more station information and data.
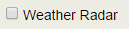
Checking or unchecking the weather radar check box shows or hides the weather radar map layer.
Clicking the question mark icon ( ![]() ) to the left of the check box or
clicking on the legend image below the check box opens this help documentation.
) to the left of the check box or
clicking on the legend image below the check box opens this help documentation.
The real-time weather radar map layer is CONUS NEXRAD Base Reflectivity (n0q) obtained from Iowa Environmental Mesonet (IEM). Base reflectivity is a measure of radar echo intensity and measured in dBZ (decibels of Z, where Z represents the reflected energy).
The following color scale is used for mapping base reflectivity values:

While radar signals can be reflected because of a variety of meteorological phenomena, base reflectivity values can be useful in estimating precipitation as follows:
| Base Reflectivity (dBZ) |
Precipitation Rate (inches/hour) |
Description |
|---|---|---|
| <20 | 0 | No precipitation |
| 20 | <0.1 | Trace |
| 30 | 0.1 | Light to moderate |
| 36 | 0.25 | Moderate |
| 41 | 0.5 | Moderate |
| 47 | 1.25 | Moderate to heavy |
| 52 | 2.5 | Heavy |
| 55 | 4 | Very heavy |
| 60 | 8 | Extreme |
| >65 | 16+ | Extreme |
An overview map showing the currently viewed map area within a larger context (example below) can be opened or closed by checking or unchecking the overview map check box
or clicking the arrow in the lower-left corner of the map ( ).
Double-clicking inside the overview map will also close it.
).
Double-clicking inside the overview map will also close it.
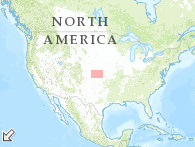
The red rectangle in the overview map shows the extent of the main map. It may be dragged to pan the main map viewer to a new location.

The sliders in the base map, real-time streamflow, and weather radar sections of the map contents panel can be used to adjust the transparency of their respective layers. Sliders are disabled when their layers are not shown on the map.
NOTE: Some sliders may be hidden for web browsers that do not support layer transparency.