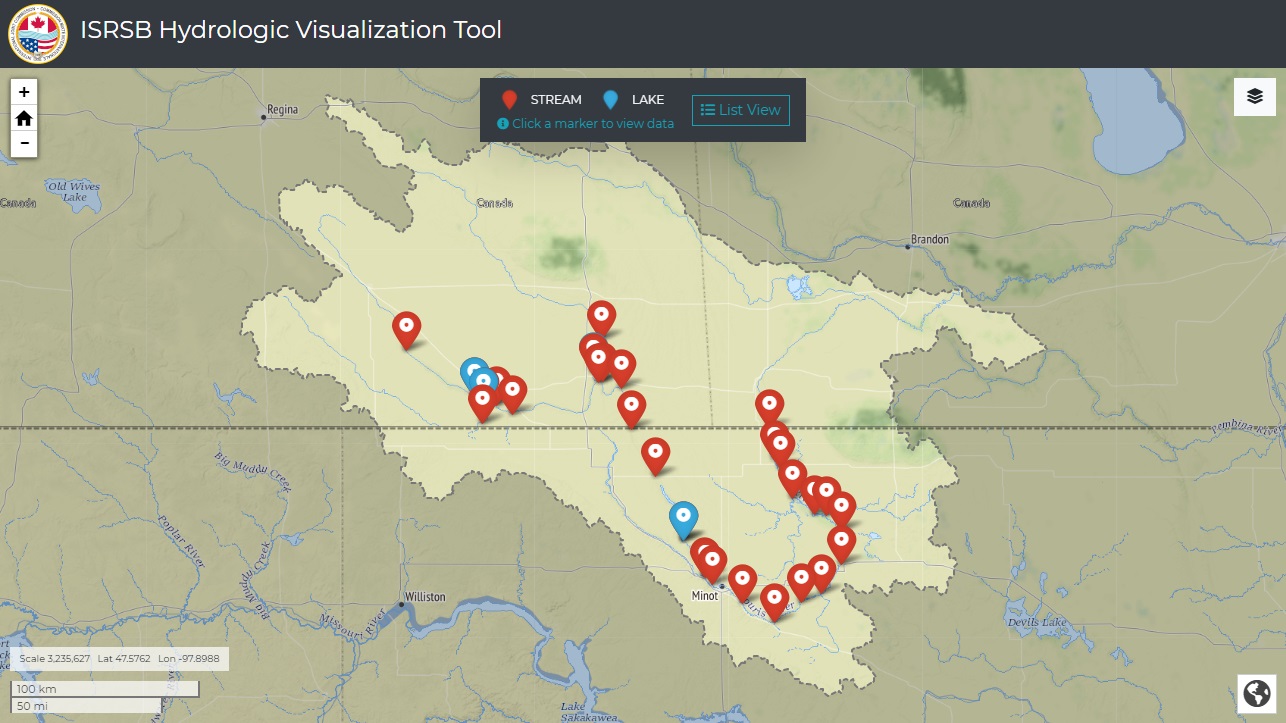

Flooding in 2011 on the Souris River focused attention on review of the existing Operating Plan that governed binational river operations as part of the 1989 International Agreement and evaluation of additional flood protection measures. The International Souris River Study Board (ISRSB) was formed to complete the review of the existing Operating Plan and propose any improvements that could be made. Many of the improvements evaluated by the ISRSB were modeled alternatives to the current operating plan and the ISRSB recognized the need to display the results of these alternatives in a way that was easy to distribute and allowed for individuals to complete their own assessment of each alternative.
The ISRSB worked with the USGS to develop an online Hydrologic Visualization Tool to view, filter, and compare hydrologic data from model outputs representing baseline conditions and multiple potential alternative scenarios. The ISRSB's Hydrologic Visualization Tool is useful for ISRSB staff, as well as the ISRSB's Resource Agency Advisory Group and Public Advisory Group.
As proposed, the ISRSB Hydrologic Visualization Tool includes simulations from the United States Army Corp of Engineers Hydrologic Engineering Center's Reservoir Simulation model of the Souris River, which was developed by the ISRSB to simulate various reservoir operation alternatives to compare reservoir surface elevations and streamflow at several locations in the Souris River basin.


Navigating the Viewer Interface
To open the plot window, click on a stream or lake site on the map. You may also click on the List View button at the top center of the map to select from an alphabetical list of stream and lake sites.
The layers menu includes multiple background layer options, opacity controls, and river, subbasin, and wildlife refuge overlays.
Plot Options
The plot opens with the baseline simulation, which shows reservoir operations and river flows according to Annex A/B of the International Agreement for the period 1930-2017.
Plot Navigation/Display Options
 Add different alternatives to plot
 Clear plot area
 Select the normal timeline or baseline differences
 View summary statistics for selected alternatives
 Select imperial or metric units
 Use a linear or log y-scale for the graph
 View map of the selected stream/reservoir site
 Download data
Alternative Models
Alternative modeling was completed in 5 phases. Each phase built on the results of the previous phase, and the level of analysis conducted on the results increased over time.
Phase 216 available alternatives
Phase 328 available alternatives
Phase 3.510 available alternatives
16 available alternatives
Phase 55 available alternatives
Questions? Comments? Email Us