| State | Waterbody | Date of most recent chlorophyll-a map |

Motivation
Harmful algal blooms (HABs) are a growing concern in U.S. waterbodies. Toxins produced by HABs pose risks to human and animal health. Local economies may also be adversely affected when algal blooms discourage outdoor recreation. To assist in monitoring algal bloom conditions, scientists at the USGS Oklahoma-Texas Water Science Center and the USGS Idaho Water Science Center have developed methods to detect chlorophyll-a with satellite data. Chlorophyll-a, a green pigment found in both algae and cyanobacteria found in HABs, is commonly used as a proxy indicator of algal blooms. Earth observing satellite imaging supports field monitoring by capturing multispectral images of entire waterbodies with a frequency of greater than one capture per week. This project applies the chlorophyll-a detection methods to satellite imagery of selected waterbodies in Idaho and Texas to help management agencies know when and where to test water quality.
Acknowledgements
This product was produced in collaboration with the Idaho Department of Water Resources, Idaho Department of Environmental Quality, Idaho Power Company, North Texas Municipal Water District, and the City of Dallas. It is a USGS Harmful Algal Bloom (HAB) Cooperative Matching Funds project within the National Water Quality Program.
| Idaho Layers | |
|---|---|
| Analyzed Waterbodies | Outline of waterbodies for which aquatic reflectance was computed and the chlorophyll-a exceedance probability model was applied. Waterbodies include: Lake Cascade, Brownlee Reservoir, Lake Lowell, Magic Reservoir, Mormon Reservoir, Island Park Reservoir, Henrys Lake, Brownlee Reservoir, American Falls Reservoir, Hells Canyon Reservoir, Oxbow Reservoir, Lake Cascade, Blackfoot Reservoir, Salmon Falls Creek Reservoir, Cedar Creek Reservoir, Crane Creek Reservoir, Lake Hayden, Fernan Lake, Palisades Reservoir, Cocolalla Lake, Coeur d’Alene Lake, Thorn Creek Reservoir, Payette Lake, Mackay Reservoir, C J Strike Reservoir, Lake Pend Oreille, and Horsethief Reservoir. Waterbody outlines are from the National Hydrography Dataset Plus High Resolution. |
| Probability Chlorophyll-a > 10 μg/L | Probability of exceeding 10 micrograms per liter (μg/L) approximated using the augmented multivariate logistic regression model presented in King and others (2022) applied to aquatic reflectance values from the dark spectrum fitting approach in ACOLITE (Vanhellemont and Ruddick, 2018). |
| Mean Probability Chlorophyll-a > 10 μg/L | Mean chlorophyll-a exceedance probability computed from the "Probability Chlorophyll-a >10 μg/L" over the number of days before and after the date specified in the date slider. The number of days in the averaging window is specified by the user in the information panel. |
| Maximum Chlorophyll Index (MCI) | The Maximum Chlorophyll Index (MCI) (Le and others, 2013) is an uncalibrated index used to provide a relative comparison in approximate chlorophyll-a condition between waterbodies. MCI is computed as Band 5 - (Band 4 + (Band 6 - Band 4)*[(704-665)/(741-665))] where bands 4 (red), 5 (red-edge), and 6 (visible near infrared) are Sentinel-2 surface reflectance bands. The MCI is conceptually similar to measuring the vertical distance between band 5 reflectance and a straight line drawn between the reflectance values of bands 4 and 6. |
| Normalized Difference Chlorophyll-a Index | The normalized difference chlorophyll index (NDCI) (Mishra and Mishra, 2012) is an uncalibrated index used to provide a relative comparison in approximate chlorophyll-a condition between waterbodies. NDCI is computed as (Band 5 - Band 4)/(Band 4 + Band 5) where bands 4 (red) and 5 (red-edge) are Sentinel-2 surface reflectance bands. |
| Normalized Difference Turbidity Index | Normalized Difference Turbidity Index (NDTI) (Lacaux and others, 2007) is an uncalibrated index used to provide a relative comparison in approximate inorganic turbidity water quality conditions. NDTI is computed as (Band 4 - Band 3)/(Band 4 + Band 3) where bands 3 (green) and band 4 (red) are Sentinel-2 surface reflectance bands. |
| Sentinel-2 Surface Reflectance true-color overpass | The Harmonized Sentinel-2A and Sentinel-2B MultiSpectral Instrument Surface Reflectance image collection, processed to minimize the influence of atmospheric conditions, are mosaicked for each satellite overpass and visualized in true-color to aid in image interpretation. These satellites have a combined return period of 5 days, but clouds and smoke can obscure land and water surfaces and extend the time between clear observations. Imagery brightness can be adjusted by the user. The uncalibrated water quality indices are computed from the bands in this layer. |
| Sentinel-2 Top Of Atmosphere true-color overpass | The Harmonized Sentinel-2A and Sentinel-2B MultiSpectral Instrument Top Of Atmosphere image collection are mosaicked for each satellite overpass and visualized in true-color to aid in image interpretation. These satellites have a combined return period of 5 days, but clouds and smoke can obscure land and water surfaces and extend the time between clear observations. The Top Of Atmosphere image collection is included because it extends further back in time than the Sentinel-2 Surface Reflectance product. |
| Landsat 8/9 Top Of Atmosphere true-color overpass | The Landsat-8 and Landsat-9 collection 2 tier 1 Top Of Atmosphere image collections (Wulder and others, 2019) are mosaicked for each satellite overpass and visualized in true-color to aid in image interpretation. These satellites have a combined return period of 8 days, but clouds and smoke can obscure land and water surfaces and extend the time between clear observations. Imagery brightness can be adjusted by the user. |
| Texas Layers | |
| Analyzed Waterbodies | Estimated chlorophyll-a concentration was calibrated for ten waterbodies based on field data collected in 2020: Lakes Fork Reservoir, Grapevine Lake, Jim Chapman Lake, Lavon Lake, Lake Lewisville,Lake Palestine, Ray Hubbard Lake, Ray Roberts Lake, Lake Tawakoni, and Lake Texoma. Waterbody outlines from the National Hydrography Dataset Plus High Resolution are provided to aid in the interpretation of aquatic chlorophyll-a detection. |
| Sentinel-2 estimated Chlorophyll-a, μg/L | Light reflectance detected by the Sentinel-2A/B satellites is utilized to estimate aquatic chlorophyll-a concentration, in micrograms per liter (μg/L), of photosynthetic phytoplankton entrained in or accumulating on the water surface. See Stengel (2023) for research methodology and discussion of near real-time aquatic chlorophyll-a monitoring. |
| Sentinel-2 estimated mean Chlorophyll-a, μg/L | This layer provides a baseline average of chlorophyll-a concentration (μg/L) to compare with daily chlorophyll-a concentrations observed by an individual overpass. The number of days in the averaging window defaults to 365 days and can be adjusted by the user. |
| Sentinel-2 Normalized Difference Turbidity Index (uncalibrated) | Normalized Difference Turbidity Index (NDTI) (Lacaux and others, 2007) is an uncalibrated index used to provide a relative comparison in approximate inorganic turbidity water quality conditions. NDTI is computed as (Band 4 - Band 3)/(Band 4 + Band 3) where bands 3 (green) and band 4 (red) are Sentinel-2 surface reflectance bands. |
| Sentinel-2 Surface Reflectance true-color overpass | The Harmonized Sentinel-2A and Sentinel-2B MultiSpectral Instrument Surface Reflectance image collection, processed to minimize the influence of atmospheric conditions, are mosaicked for each satellite overpass and visualized in true-color to aid in image interpretation. These satellites have a combined return period of 5 days, but clouds and smoke can obscure land and water surfaces and extend the time between clear observations. Imagery brightness can be adjusted by the user. The uncalibrated water quality indices are computed from the bands in this layer. |
| Landsat 8/9 Top Of Atmosphere true-color overpass | The Landsat-8 and Landsat-9 collection 2 tier 1 Top Of Atmosphere image collections (Wulder and others, 2019) are mosaicked for each satellite overpass and visualized in true-color to aid in image interpretation. These satellites have a combined return period of 8 days, but clouds and smoke can obscure land and water surfaces and extend the time between clear observations. Imagery brightness can be adjusted by the user. |
| Sensor Limitations | |
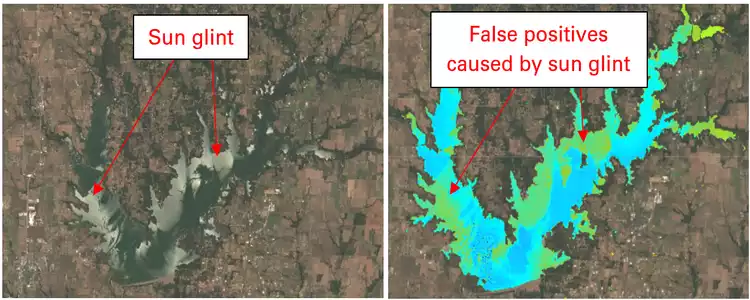
| Clouds and Glint |
Clouds, cloud shadow, smoke, and sun glint interfere with the accurate estimation of chlorophyll-a, and water-quality constituents in general, from satellite imagery. These sources of interference can result in under and overestimates in water-quality retrievals. Operational cloud masks are applied to minimize cloud interference but are not 100 percent accurate in removing potential cloud interference. For example, cloud shadows may persist in the water-quality products (shown below). Sun glint (shown below) is defined as specular reflection off the water surface, is often associated with strong winds and is exacerbated by viewing geometries that put the water body between the satellite sensor and the sun. Sun glint is not currently masked in derived products. True-color images are included to aid the user in identifying potential interferences from clouds, cloud shadow, smoke, and glint. 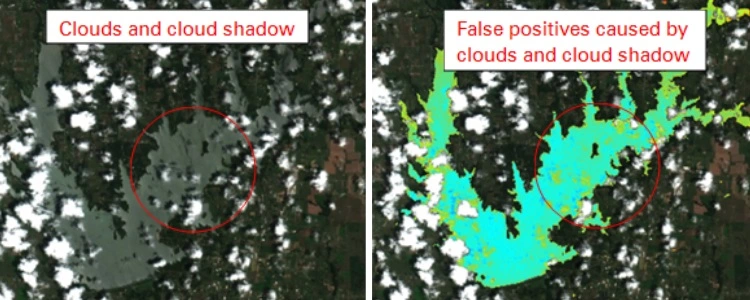
|
| References Cited | |
|
King, T.V., and Hafen, K.C., 2022, Chlorophyll-a concentrations and algal bloom condition paired with Sentinel-2 aquatic reflectance values collected for Brownlee Reservoir, ID from 2015 through 2020: U.S. Geological Survey data release, https://doi.org/10.5066/P9GF0CBG. King, T.V., Hundt, S., Hafen, K., Stengel, V., and Ducar, S., 2022, Mapping the probability of freshwater algal blooms with various spectral indices and sources of training data: Journal of Applied Remote Sensing, v. 16, no. 04, https://doi.org/10.1117/1.JRS.16.044522. Lacaux, J.P., Tourre, Y.M., Vignolles, C.J., Ndione, J.A., and Lafaye, M., 2007, Classification of ponds from high-spatial resolution remote sensing: Application to Rift Valley Fever epidemics in Senegal: Remote Sensing of Environment, v. 106, p. 66-74, https://doi.org/10.1016/j.rse.2006.07.012. Le, C., Hu, C., Cannizzaro, J., English, D., Muller-Karger, F., and Lee, Z., 2013, Evaluation of chlorophyll-a remote sensing algorithms for an optically complex estuary: Remote Sensing of Environment, v. 129, p. 75-89, https://doi.org/10.1016/j.rse.2012.11.001. Mishra, S., and Mishra, D.R., 2012, Normalized difference chlorophyll index: A novel model for remote estimation of chlorophyll-a concentration in turbid productive waters: Remote Sensing of Environment, v. 117, p. 394-406, https://doi.org/10.1016/j.rse.2011.10.016. Sievers, J.M., Stengel, V.G., and Trevino, J.M., 2022, Surface-water characteristics and phytoplankton taxonomy in selected north Texas reservoirs using biological, hyperspectral, and water-quality methods, 2019-2020: U.S. Geological Survey data release, https://doi.org/10.5066/P9X1R5IM. Vanhellemont, Q., and Ruddick, K., 2018, Atmospheric correction of metre-scale optical satellite data for inland and coastal water applications: Remote Sensing of Environment, v. 216, p. 586-597, https://doi.org/10.1016/j.rse.2018.07.015. Wulder, M. A., Loveland, T. R., Roy, D. P., Crawford, C. J., Masek, J. G., Woodcock, C. E., Allen, R. G., Anderson, M. C., Belward, A. S., Cohen, W. B., Dwyer, J., Erb, A., Gao, F., Griffiths, P., Helder, D., Hermosilla, T., Hipple, J. D., Hostert, P., Hughes, M. J., Huntington, J., Johnson, D. M., Kennedy, R., Kilic, A., Li, Z., Lymburner, L., McCorkel, J., Pahlevan, N., Scambos, T. A., Schaaf, C., Schott, J. R., Sheng, Y., Storey, J., Vermote, E., Vogelmann, J., White, J. C., Wynne, R. H., Zhu, Z., 2019, Current status of Landsat program, science, and applications: Remote Sensing of Environment, v. 225, p. 127-147, https://doi.org/10.1016/j.rse.2019.02.015. |
|
| Disclaimer |
Any use of trade, firm, or product names is for descriptive purposes only and does not imply endorsement by the U.S. Government. |