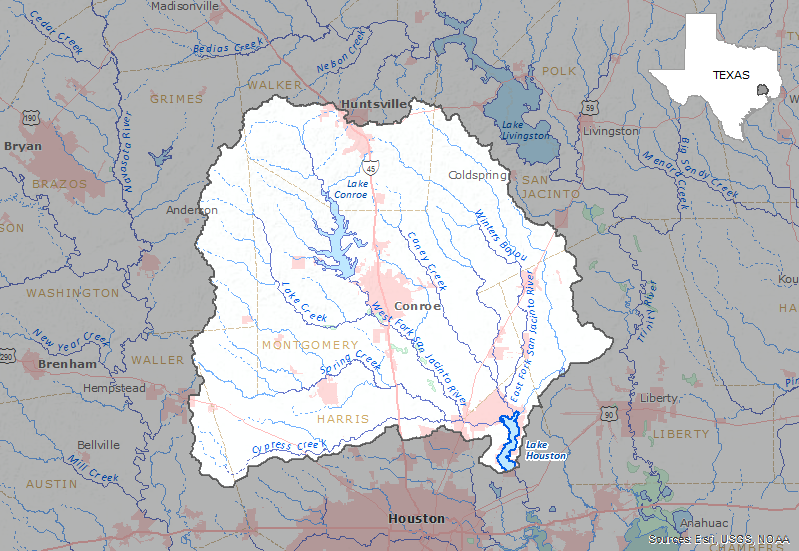
In cooperation with the City of Houston, the U.S. Geological Survey collects, processes, and interprets water-quality, streamflow, and reservoir water elevation and capacity data. These data are collected to better understand the effects of urbanization in Lake Houston, a drinking water reservoir in Houston, Texas. The combined monitoring efforts of Lake Houston and the associated watershed increase the understanding of the effects of natural and controlled inflows, nutrient and sediment loads, and water-column structure on the chemistry and biology of Lake Houston.
Real-Time Water-Quality Monitoring
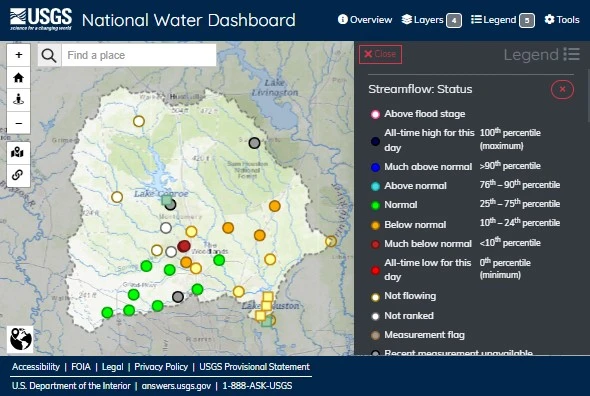
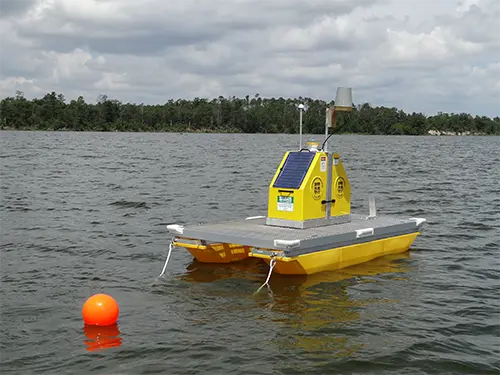
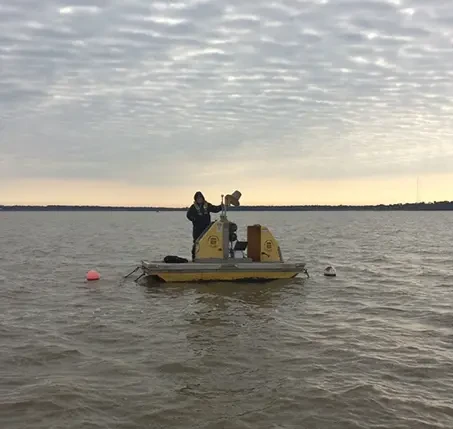
Since 2005, two USGS monitoring stations in the Lake Houston watershed evaluate the effects of watershed influences and in-lake processes on Lake Houston water quality. These continuous water-quality monitoring stations are located in both the rural and the urbanized portions of the watershed. The real-time floating monitoring stations provide:
- Hourly water quality data, including temperature, conductance, pH, dissolved oxygen and turbidity.
- Real-time notification of water-quality changes in Lake Houston.
- Water treatment facility operators the real-time data required to make informed decisions when adjusting treatment methods in response to changing environmental conditions.
Using the Data
The interactive graph below shows turbidity measured at three real-time water quality monitoring locations within the watershed. Typical and elevated turbidity ranges can be explored for all three water-quality locations to explore how changes in turbidity move through the watershed. Results are used to better understand fluctuations of water quality concentrations and loads during changing seasons and flow conditions. Turbidity, for example, can be used as an indicator for the presence of suspended sediment or algae in the lake that may cause taste and odor problems. As shown on the graph, low turbidity or base-flow conditions are seasonal and are often be seen during the month of October.
Examples of elevated turbidity associated with periods of intense rainfall and high streamflow can be seen on the graph below during the following dates:
- Memorial Day flood around May 28, 2015
- Tax Day Flood around April 17-18, 2016
- Hurricane Harvey from August 25-29, 2017
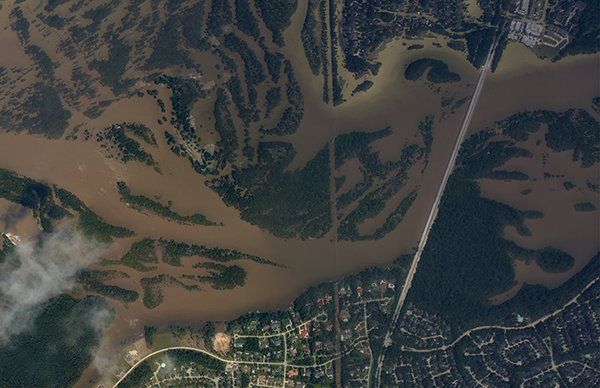
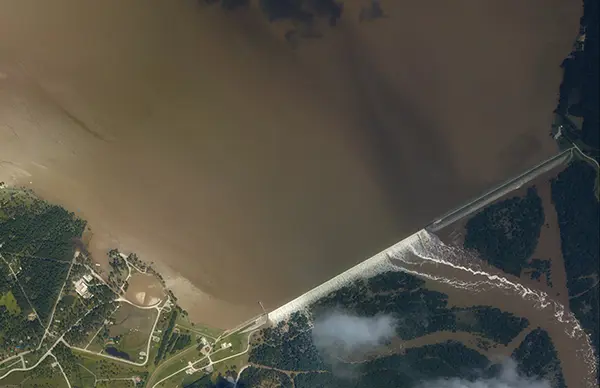
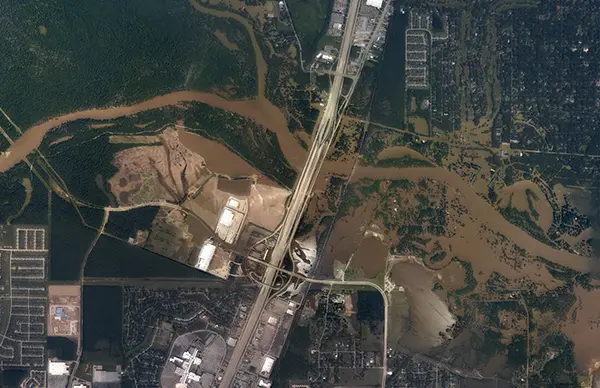
Typical and Elevated Turbidity
Click the images or drag the vertical dividers to compare turbidity conditions. The left and right parts of the images show typical and elevated conditions, respectively.
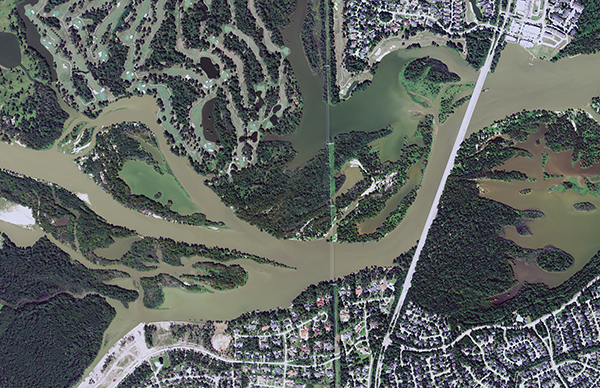
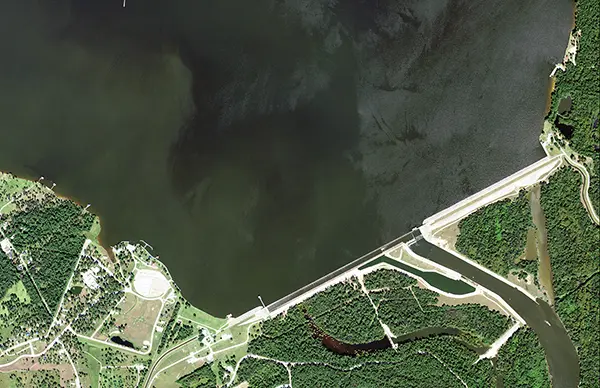
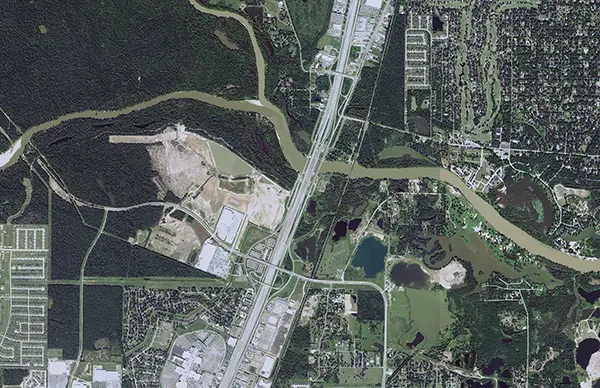
Typical turbidity images are from the U.S. Department of Agriculture (USDA) Farm Service Agency (FSA) Aerial Photography Field Office (APFO) National Agriculture Imagery Program (NAIP), September, 2016. Imagery available at https://datagateway.nrcs.usda.gov/.
Elevated turbidity images are from the Department of Commerce (DOC), National Oceanic and Atmospheric Administration (NOAA), National Ocean Service (NOS), National Geodetic Survey (NGS), Remote Sensing Division, August, 2017. Imagery available at https://storms.ngs.noaa.gov/storms/harvey/index.html#7/28.400/-96.690.