
What We're Learning
Where are People Using Domestic Wells and What Portion of the Aquifer Supplies Those Wells?
The GAMA program expanded its emphasis to include shallow groundwater used by these domestic wells because the shallower zone generally has poorer water quality than the deeper areas tapped by public supply wells. These three studies were conducted to provide a starting point for GAMA shallow groundwater-quality assessments. They also provide a starting point for identifying whether disadvantaged communities are present in these locations.
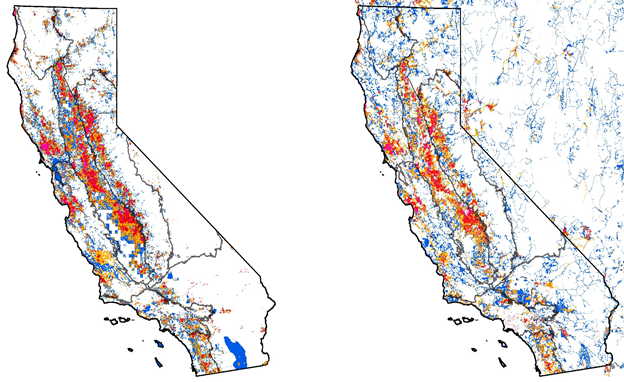
Figure 1 presents relative domestic-well density in the state with red areas being the densest, blue areas the least dense, and white areas representing locations without domestic wells. Each map was developed using different estimation methods: 1(a) developed by Johnson and Belitz (2015) uses a statistical subsampling of the well completion records and U.S. Census data, and 1(b) developed in Johnson, Belitz, and Lombard (2017) uses road networks and U.S. Census data. The two different methods have comparable results, and the second can be used anywhere in the country.
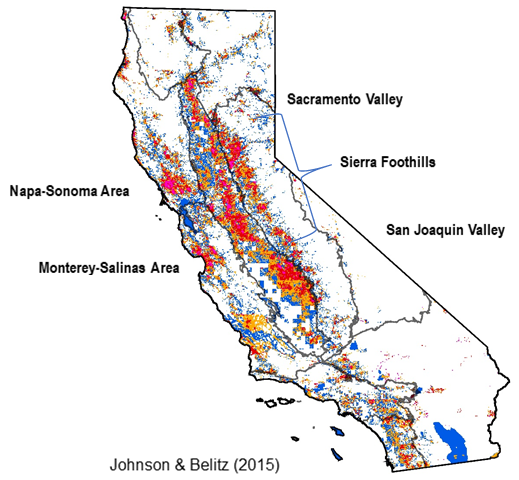
The areas with the highest density of domestic wells in the State (Fig. 2) are the San Joaquin and Salinas Valleys and part of the Sacramento Valley, the Napa-Sonoma and Salinas-Monterey areas, and the western-slope Sierra foothills concentrated around the Sacramento. The foothills fractured-rock aquifer systems are outside of the current focus of groundwater management efforts in alluvial basins, but in a CDWR study (2014) of wells that had been deepened as a result of the drought, the single highest concentration in the state was in the Sierra foothills in the Bear-Yuba and American-Cosumnes-Mokelumne watersheds.
Voss and others (2018) used the newly compiled data on domestic well location and depth in the Central Valley and previous information on public supply well depths to compare portions of the aquifer used by different systems. Figure 3 shows their results in graphic format, most notably the shallower depths of domestic wells in comparison to public supply wells in a graphical format.