
What We're Learning
Nothing Happens Right Away--Predicting Decreases in Nitrate Concentrations After Zero Loading is Achieved
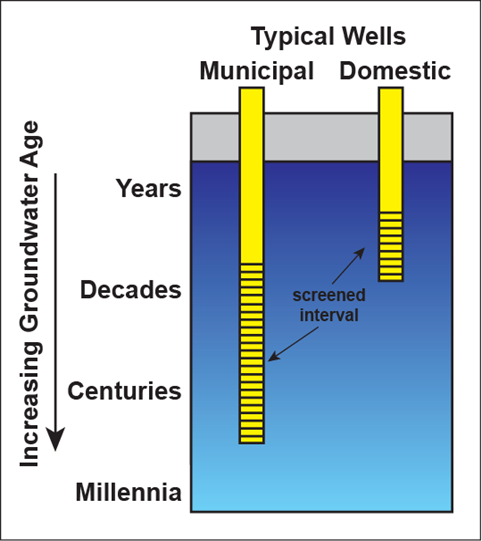
This story focuses on how we use groundwater age to predict changes in nitrate concentrations over time. Typically, deep public supply wells draw from deeper parts of the aquifer where water is decades, centuries, or even millenia old. Some wells in the San Joaquin Valley, for example, are deep enough that they are pulling water that was recharged 10,000 years ago. Shallow domestic wells are generally tapping younger water recharged years to decades ago.
Understanding the distribution of groundwater age in a system allows you to predict how concentrations of constituents that track with age will change over time with given rates of recharge. Nitrate is an example of a constituent found in higher concentrations in younger, shallower water in the San Joaquin Valley.
For a single well, sampling and analyzing for groundwater age-tracers in a well like carbon-14, noble gases, tritium can be used to calculate the age distribution of pumped water that matches the mixture of age-tracer results (Jurgens, Bohkle, and Eberts, 2012). Figure 2 shows a comparison of calculated proportions of groundwater age at the Modesto public supply well. The black line is from the detailed groundwater flow model and the blue and red lines are from the water quality method using two different assumptions.
If all nitrate loading hypothetically stopped in 2020, these models show the nitrate concentrations in pumped water continuing to increase for another decade before they start to decline (Figure 3). They also demonstrate that it takes decades to achieve lower concentrations.