California Oil, Gas, and Groundwater Program
Vertical Profile Data from Wells Document Oil-Field Waters Migrating From Surface Sump Ponds and Injection Sites
Summary of one set of findings from Gillespie and others, 2019
The USGS initiated salinity mapping adjacent to the largest oilfields in western Kern County at the outset of this scientific program in 2016. During work to map the regional salinity gradients to the base of the aquifer system (separate web page), groundwater salinity that was anomalously high compared to regional salinity was observed in the vertical profiles of salinity at some oil wells in and around the Lost Hills, North and South Belridge oil fields. These anomalously high salinity values most likely resulted from historical disposal of oil-field water in surface ponds and injection wells near the identified profiles.
Clay Layers are Barriers in Some Places and Not in Others
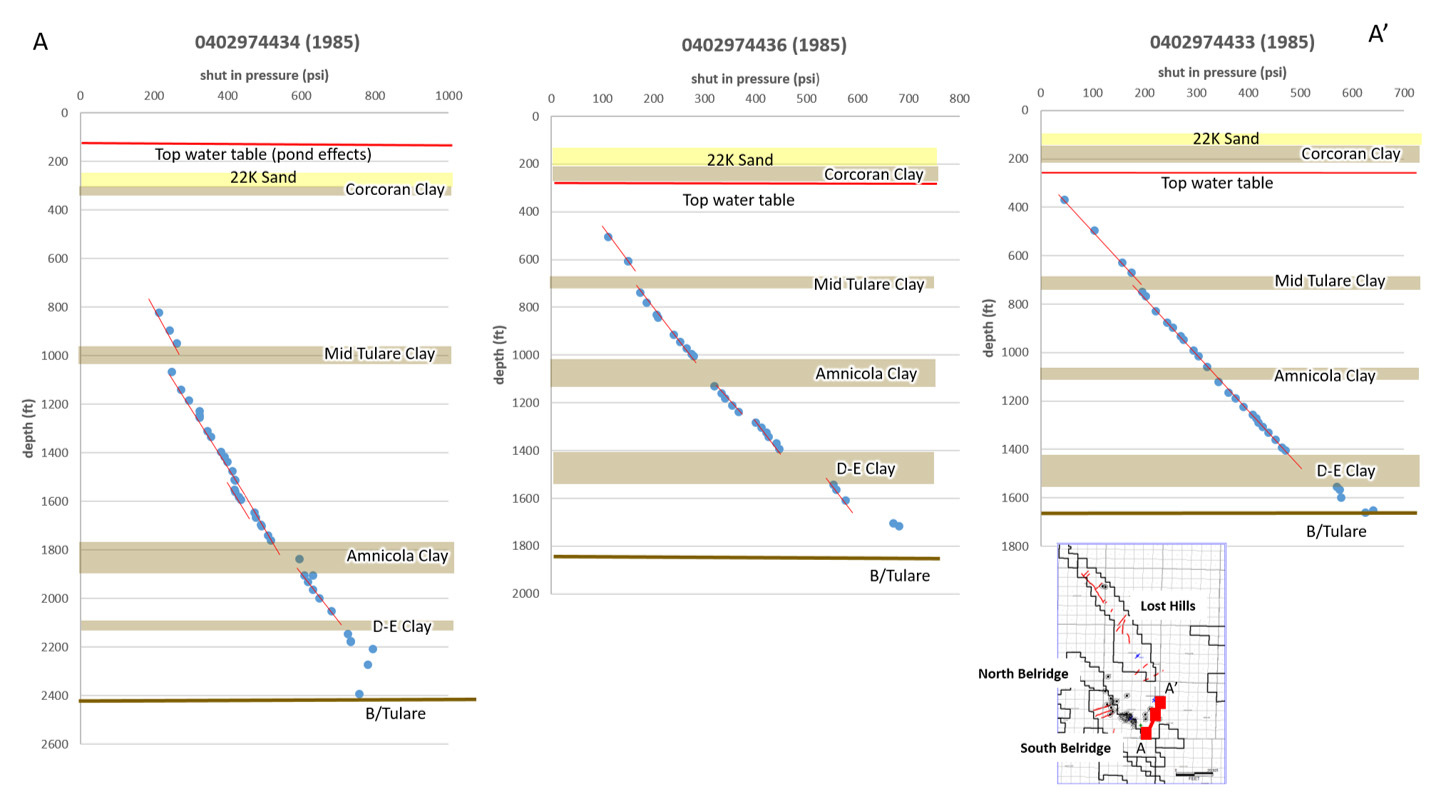
Vertical changes in pressure gradients indicate that regional clay layers affect groundwater flow adjacent to the South Belridge oil field. For example, clay layers (tan) and pressure measurements (blue dots) show how pressure gradients are continuous or not across clay layers near the South Belridge oil field at point A in the map (noted by offsets in pressure gradients across the clay). The offset in pressure gradients decreases across the same layers at A' a few miles away from the South Belridge oil field near point A’. These patterns reflect either that the clays are less confining near A’ and/or that pressure gradients near the South Belridge oil field have been perturbed by nearby production and injection activities and have not had time to equilibrate.
Filling of Unsaturated Zone Above Water Table With Sump Pond Waters
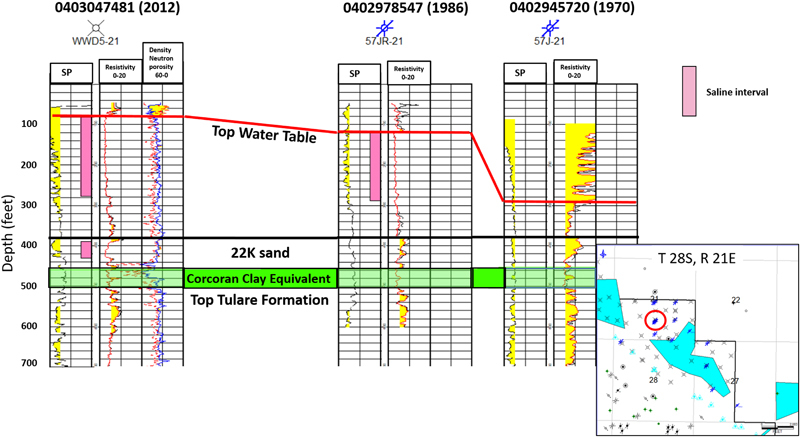
Adjacent wells drilled in 1970, 1986, and 2012 downgradient from a disposal pond showed first a gradual filling of the unsaturated zone and rise of the groundwater table with saline water. The shallow saline plumes have been documented by monitoring data collected downgradient of the surface ponds (Schulmberger Water Services, 2011).
Fluid Migration from Underground Injection of Oil-Field Waters
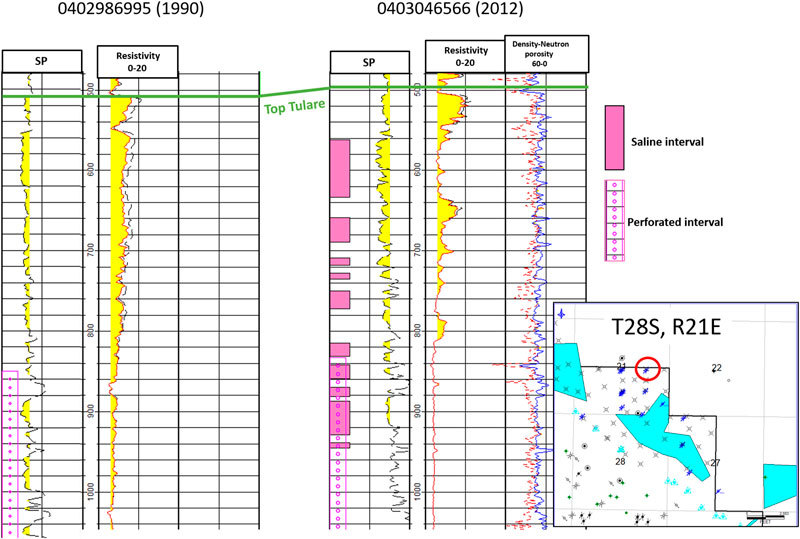
While some well records indicate the influence of surface pond waters, others indicate the migration of oil-field waters from injection wells can be seen when viewed against the gradual regional salinity gradient. This pattern is most visible in adjacent wells drilled in 1990 and 2012 in an area just east of the South Belridge oil field that contains numerous disposal wells. Pink bars superimposed on the 2012 records highlight changes in resisivity between the two dates. This shows numerous thin layers of saline waters migrating through sand layers from 1909 to 2012.